Statistics & Percentiles
Automated Weather Tools for Analysis and Operational Insights
The Statistics & Percentiles service is designed to enhance your data analysis capabilities by providing on-demand statistical insights for any weather station within our network. This service offers:

Daily and Monthly Statistics
Retrieve maximum, minimum, and mean values for a wide array of variables, allowing for efficient assessment of weather trends over custom time periods.

Percentile Distributions
Access percentile distributions for air temperature, wind speed, and wind gust variables. This feature enables you to determine whether current conditions are typical or extreme compared to historical data.
How Users are Implementing the Statistics & Percentiles Service
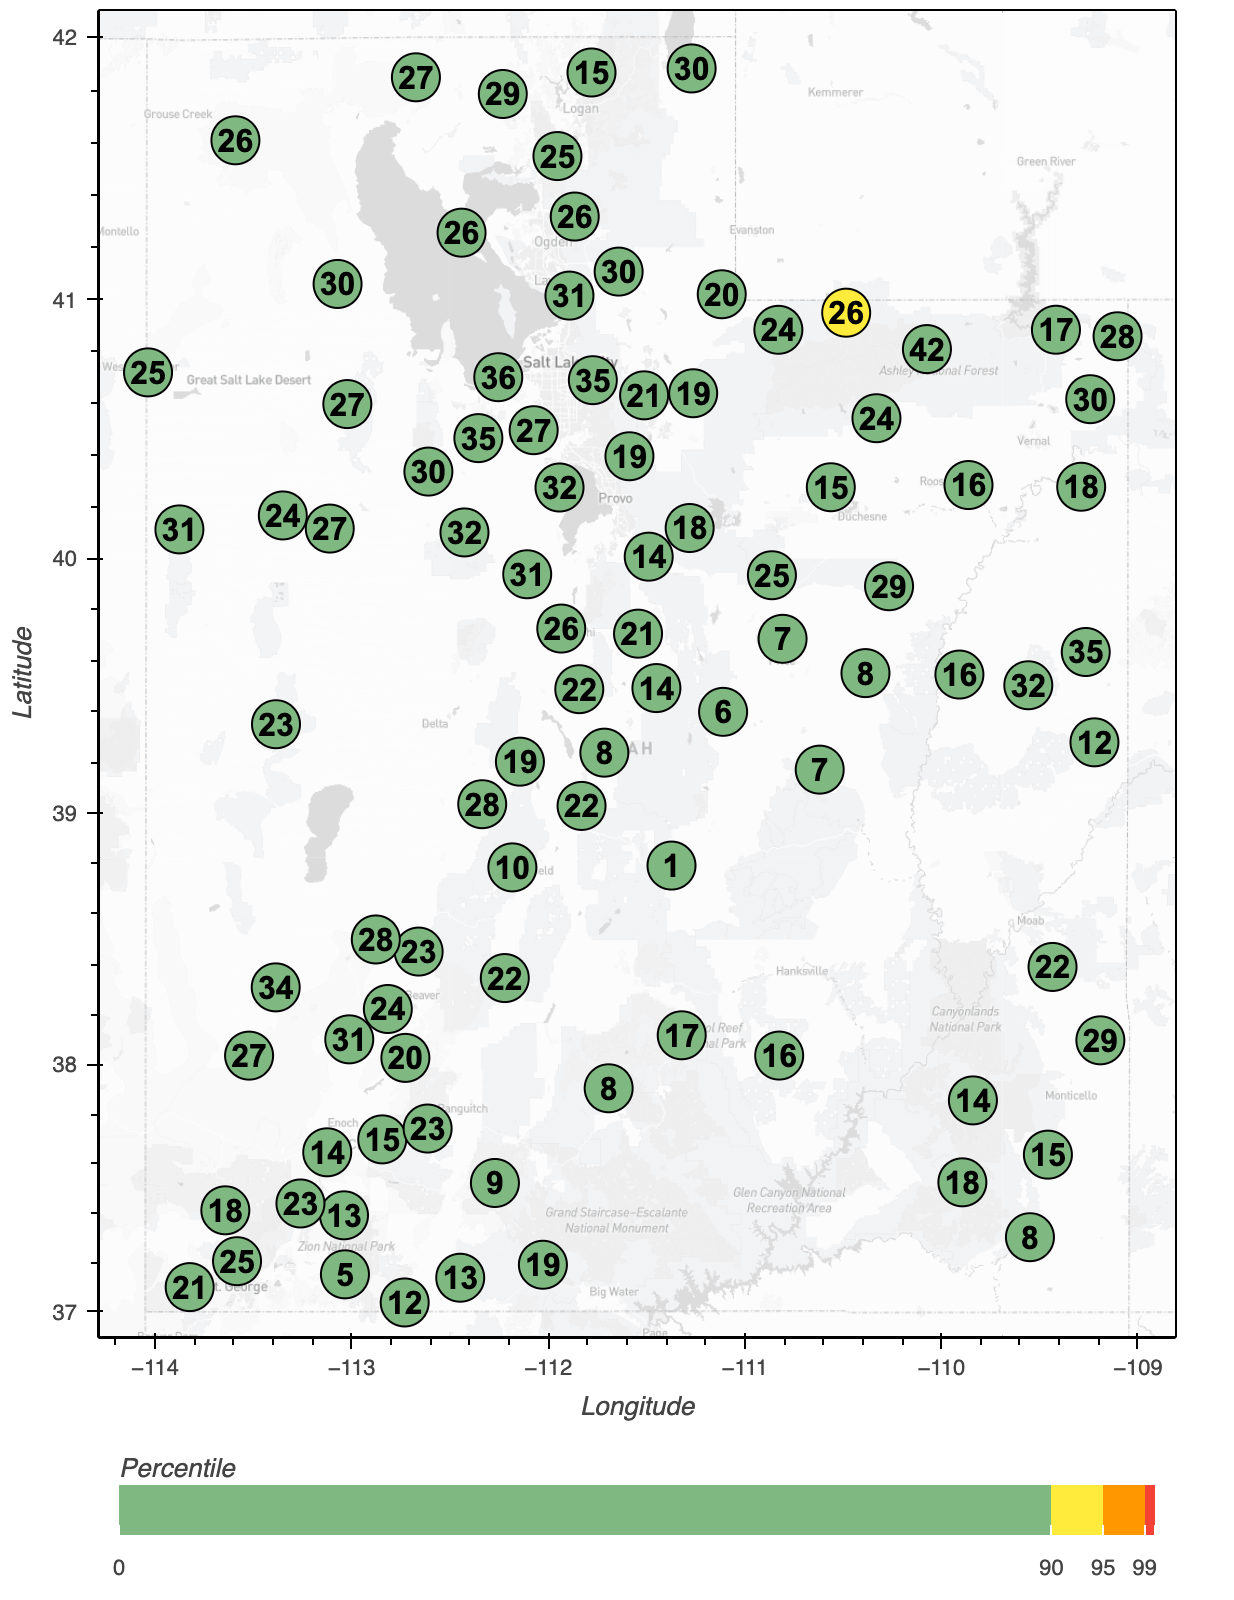
Utility customers use wind gust percentiles to provide valuable context in support of fire weather monitoring. Station historical wind gust percentile distributions provide critical, site-specific thresholds against which real time gust conditions are compared (see image). Conditions approaching and exceeding these thresholds signify extreme fire risk, and trigger actions to safeguard infrastructure and communities.
Example of wind gust values for select networks in Utah on July 21, 2025 and the gust severity relative to each station’s percentile distribution. Marker values are reported wind gusts in miles per hour. Percentile values of the wind gust reports are reflected in the marker color. All gust values fall below the stations’ 90th percentile, with the exception of a single station reporting 26 mph. Example of wind gust values for select networks in Utah on July 21, 2025 and the gust severity relative to each station’s percentile distribution. Marker values are reported wind gusts in miles per hour. Percentile values of the wind gust reports are reflected in the marker color. All gust values fall below the stations’ 90th percentile, with the exception of a single station reporting 26 mph.
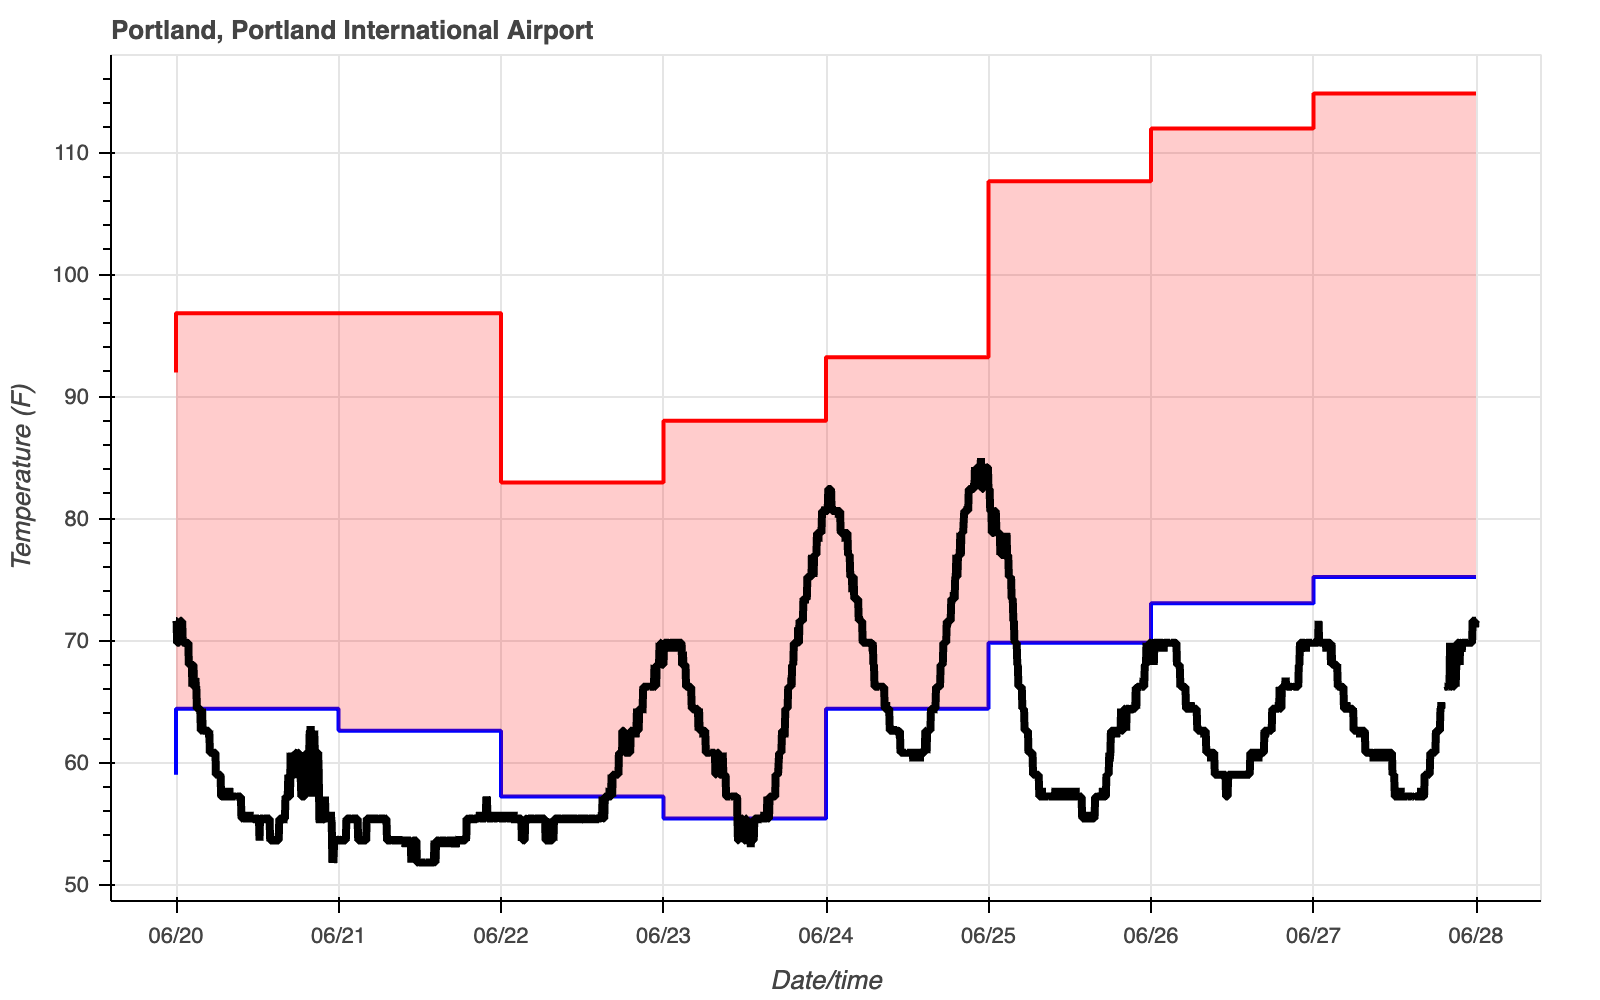
Users can leverage Synoptic’s Statistics service to provide important context to current conditions, or quickly summarize conditions over long periods of a station archive. Compare current conditions against yesterday’s extremes for quick assessment of weather trends, or understand how conditions compare to past extreme events with known impacts to assist in risk planning (see image).
Air temperature in Portland, OR during the June 20-28, 2025 period compared to the minimum and maximum values for the same period during the 2021 Pacific Northwest heat dome event (shaded). Air temperature in Portland, OR during the June 20-28, 2025 period compared to the minimum and maximum values for the same period during the 2021 Pacific Northwest heat dome event (shaded).
Benefits to Your Organization
By leveraging Synoptic’s Statistics and Percentiles Service, you can:

Save Time & Resources
Manually compiling data on a daily and monthly basis is time consuming. Reduce the time and effort spent on manual data processing by automating the retrieval and calculation of essential weather statistics.

Enhance Decision-Making
Leverage accurate statistical insights to inform critical decisions in areas like energy demand forecasting, emergency response planning, and resource allocation.

Improve Risk Assessment
Percentiles data provides historical context that helps you gauge the severity of current weather and aids in decision-making.

Ensure Data Reliability
Rely on accurate, quality-controlled data to support your analyses, minimizing the risk of errors and enhancing the credibility of your findings.
For more detailed information on our Statistics & Percentiles Service see the Statistics & Percentiles developers pages.