Synoptic Data Viewer
Discover Weather Data Globally
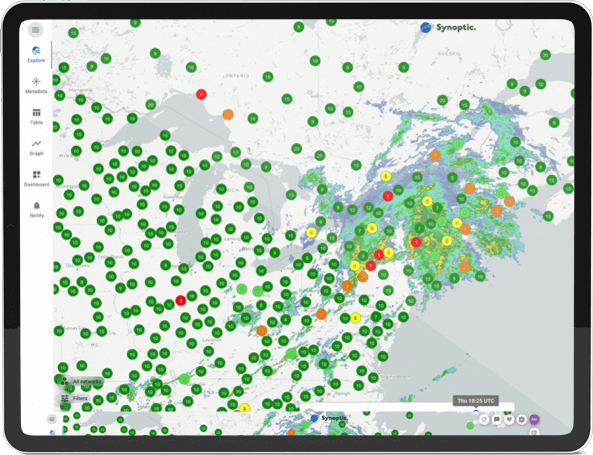
Weather data is everywhere, the challenge is finding it. The Synoptic Data Viewer brings thousands of stations together in one map-based platform, making it easy to explore, visualize, and act on the data that matters. With powerful tools for analysis and monitoring, it turns observations into actionable insight.
- 170,000+Weather
Stations - 320+Data
Sources - 160+Weather
Variables
Turn Data Into Insights With the Synoptic Data Viewer
- Access publicly available, real-time and historical weather data from over 320 networks
- A single source for viewing aggregated, quality-controlled observations worldwide
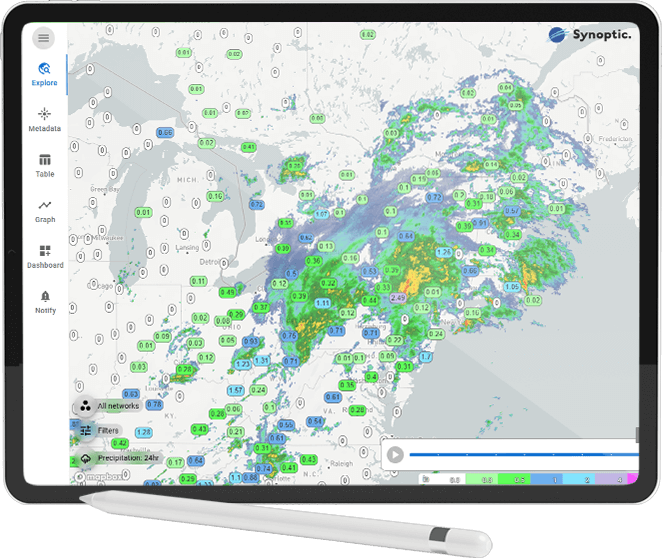
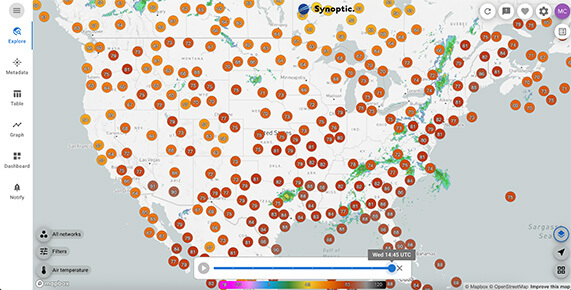
- Compare stations, monitor trends, and gain enhanced insights
- Add your network to the platform: view your data alongside other networks and share your data with other users
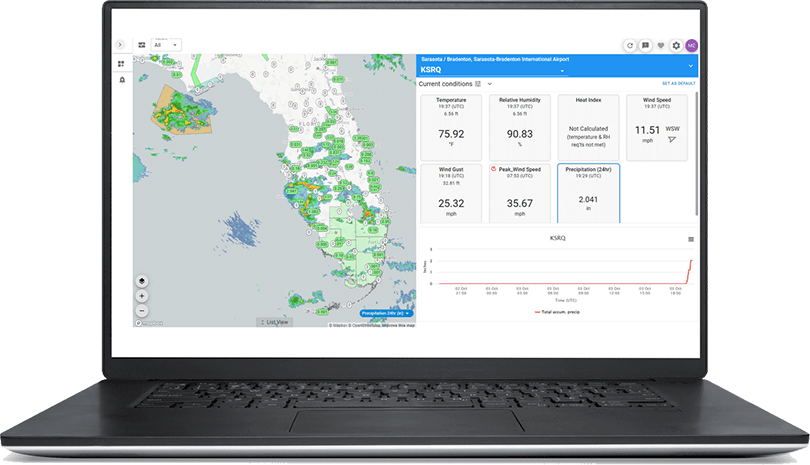
Advanced Capabilities of the Data Viewer
- Multiple views (map, tabular, time series graphs) for quick exploration and analysis
- Mobile-friendly for easy access on the go
- Save and share views, filter by region/network, and generate station reports
- View historical data for any station and reference significant events in the past
Discover New Networks and Station Data with the Metadata Explorer
Synoptic’s Metadata Explorer is part of the Data Viewer and gives you full visibility into the source and coverage of our environmental data. Explore and filter data on the Synoptic platform to help you instantly locate specific stations, variables, networks, and regions that match your requirements.
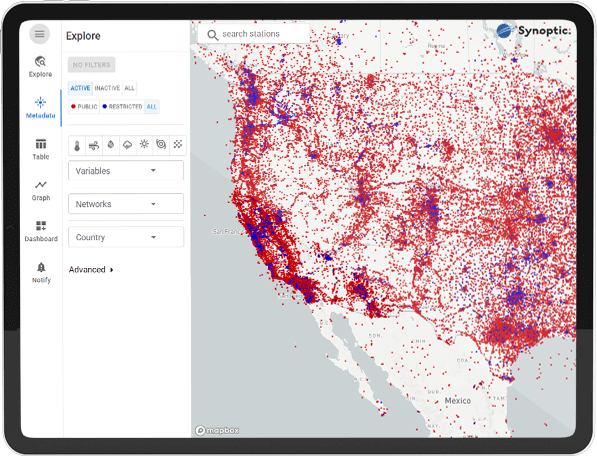
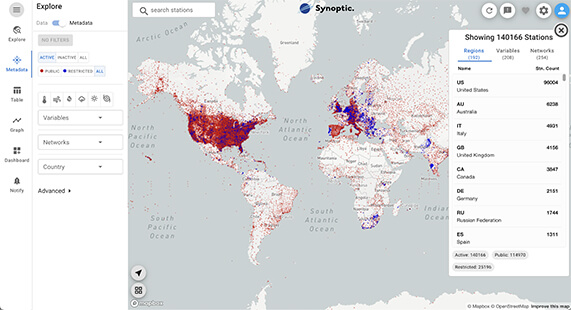
Quickly Explore the Station Catalog
- View all stations on the Synoptic Platform, with filters for status, variables, networks, and area of interest
- Search by station ID or name to find locations instantly.
- Toggle between public networks and private networks
- View the period of data record and station elevation
Watch our quick-start guide for the Data Viewer
Have more questions about the Synoptic Data Viewer?
Find answers to common questions on our Data Viewer FAQ page.

What Our Customers Have to Say
"The Synoptic Data Viewer Dashboards and Notifications tools have been an asset to the Hennepin County Emergency Management team. Being able to ingest our data, quality control check, and display accurate, up-to-the-minute environmental data allows us to make decisions confidently and save precious time in alerting the public about hazardous conditions.
The Data Viewer provides multiple ways to view data (i.e., map, time series, tables), which better help us monitor environmental conditions depending on the situation. We have been thoroughly impressed with how responsive and open to ideas the Synoptic Data team has been."
Hennepin County Emergency ManagementExplore Global Weather Data Your Way
Discover networks, stations, and monitor real-time conditions globally on the Synoptic Data Viewer today.