Synoptic Data’s New Dashboards & Notifications Visualization Tools Help Communities Weather the Storm
Synoptic Data is proud to announce the launch of enhanced features for its popular data visualization platform, the Synoptic Data Viewer. The platform now enables customers to create customized dashboards and set up real-time notifications, empowering users to track conditions in real-time and take proactive measures in response to critical weather events, receive immediate notifications when critical thresholds are met, and monitor the status of weather/environmental stations to support operations.
The new features target users who need situational awareness data for making decisions about safety and preparedness of their community or operational staff. For users who are also data providers, the platform allows them to easily monitor and maintain visibility of their own stations. Using the power of data visualization, the Dashboards and Notifications tools are ideal for users such as emergency responders or utilities, offering valuable insights about station status and current weather trends.
“We are excited to release these enhancements to our data visualization platform,” said Ashish Raval, President & CEO of Synoptic Data. “Our goal is to empower communities with the tools they need to effectively monitor environmental conditions and respond swiftly to weather-related challenges. With these new features, users can identify potential risks and take proactive measures to protect their communities and support their operations.”
Key features of the Dashboards and Notifications tools include:
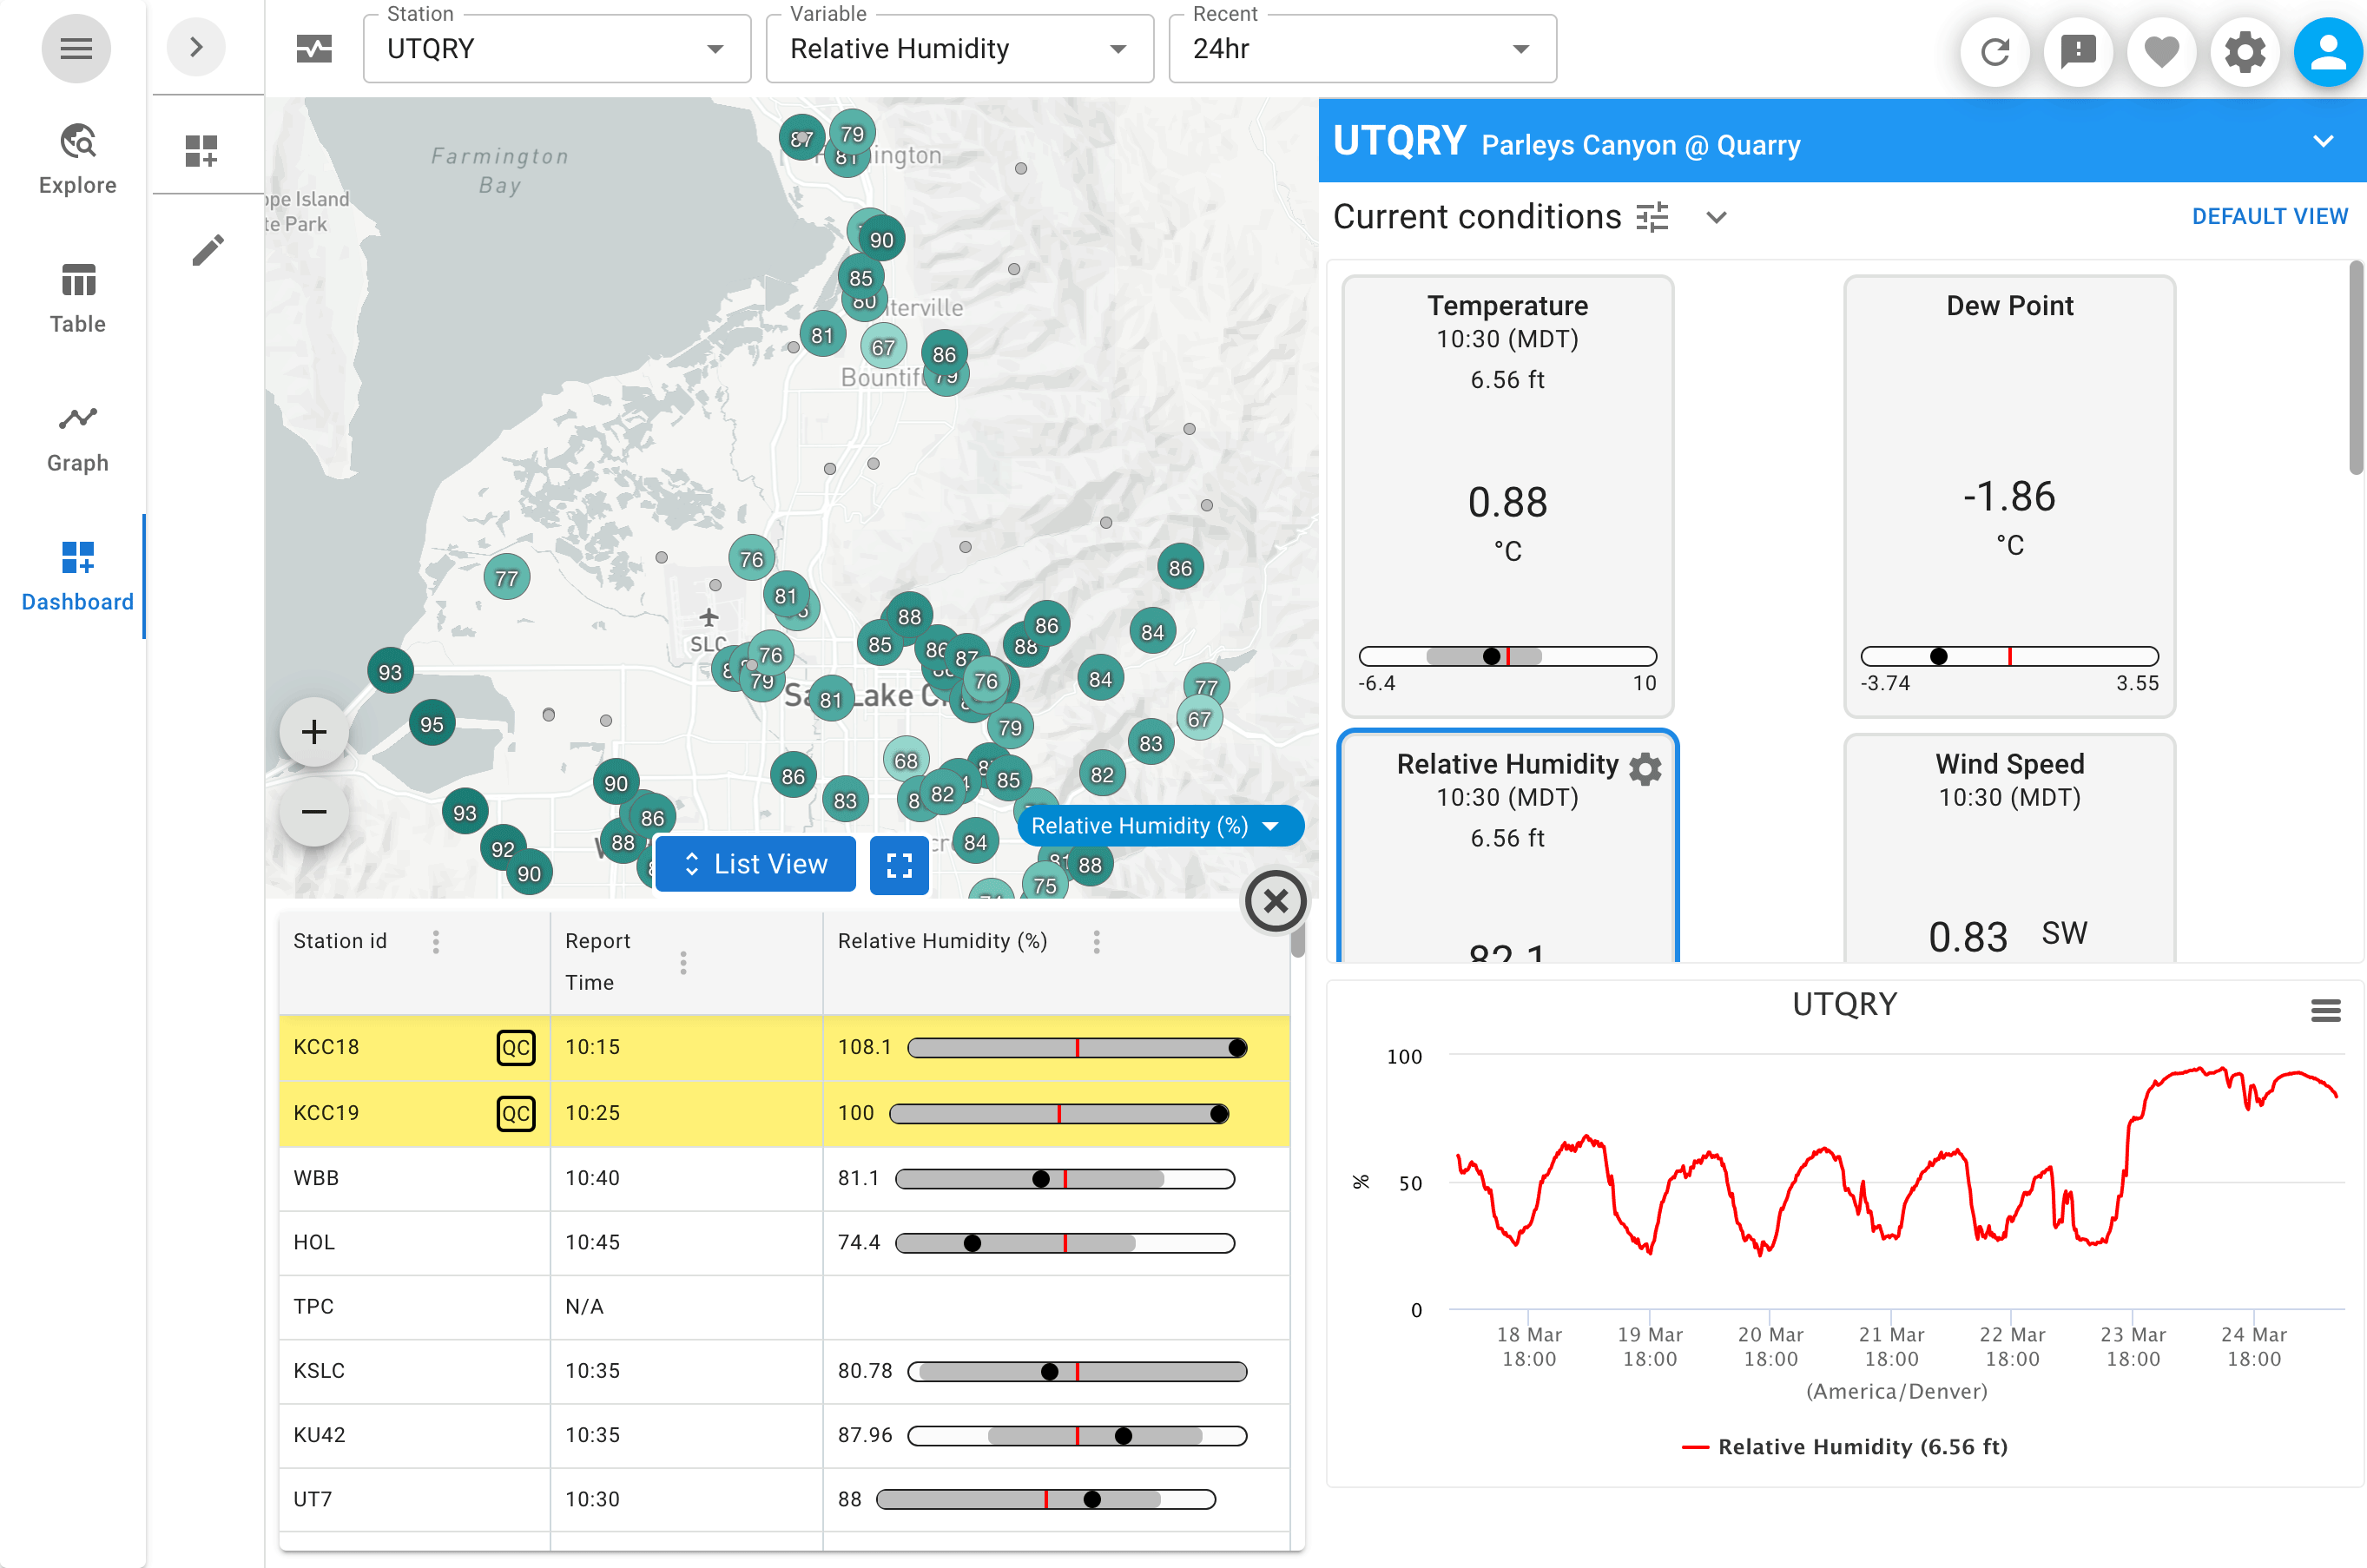
- Comprehensive Dashboards: Users can create and access customizable dashboards that provide a holistic view of environmental data, including temperature, humidity, wind speed, and more. The intuitive interface allows users to monitor trends, such as precipitation or winds, analyze events, and understand local patterns, which enables informed decision-making.
- Real-time Notifications: The platform offers customizable alerting capabilities, allowing users to receive real-time notifications when stations fail to report or specific weather conditions occur. Whether a single station is delayed from its normal reporting pattern or a sudden temperature drop, users can stay informed and take immediate action to maintain their assets and safeguard their communities.
- Station Status Monitoring: Users can monitor the status of their sensor networks with ease, ensuring optimal performance and reliability. The platform provides valuable insights into operational metrics such as battery voltage and reporting gaps, and leverages Synoptic’s real-time quality control system to give immediate visibility to outliers in the data, allowing operators to address any issues promptly.
The enhanced features reflect Synoptic Data’s commitment to support network operators, provide access to environmental data to enhance public safety, improve the productivity of government agencies and commercial entities, and assist in research and educational initiatives to advance the understanding of Earth systems.
These new features were developed along with data providers, allowing for a personalized user experience to monitor environmental conditions and make data-driven decisions to minimize the impact of extreme weather events.
For more information about the Synoptic Data Data Viewer platform and the new Dashboards and Notifications features, visit the product page.