



Inside the Heat Dome: Capturing the Data Behind a Landmark Week for Heat Records in the West
From July 10th to July 12th, America, fresh off its 250th birthday, experienced record setting high temperatures. These record setting conditions were fueled by a heat dome over the western United States, especially Utah, Montana and Wyoming. The result was a run of extraordinary daily high temperatures, confirmed station by station using real-time and historical data all within the Synoptic platform.
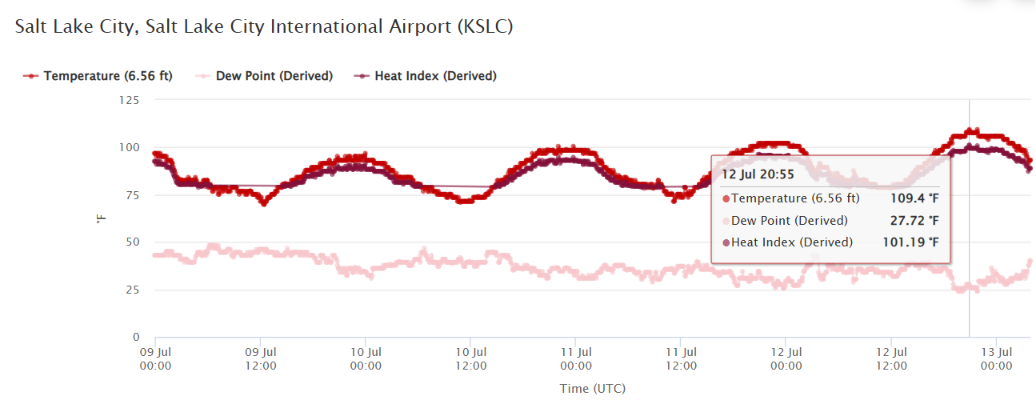
According to data from the Synoptic platform, Salt Lake City hit 109.4°F on July 12th, the hottest temperature in recorded city history.
Pulling daily maximums directly from the Salt Lake City International Airport (KSLC) weather station using Synoptic’s Statistics service shows how consistently high daytime temperatures built over several days leading up to the record setting reading on the 12th:
| Date | Daily high temperature (KSLC) |
|---|---|
| Jul 10 | 100.4°F |
| Jul 11 | 102.2°F |
| Jul 12 | 109.4°F |
| Jul 13 | 99.0°F |
Through the above chart we can see that three days of escalating heat led to a sharp peak of 109.4°F, then a moderate cooldown to sub 100 degrees occurred. Looking at the historical data, the overnight numbers provide even deeper insight. The night before the record was set, KSLC’s low was only 78°F, giving temperatures a warm head start to reach the record high. Monitoring real-time and historical data allows for better insights, giving users data about trends and possible impacts.
The Same System, Breaking Records Across Three States
Salt Lake City wasn’t an isolated case of record high temperatures; it was one example of the extreme daily highs across three states: Montana, Wyoming, and Utah, simultaneously. Synoptic also analyzed these stations: Billings, MT (KBIL), Miles City, MT (KMLS), and Sheridan, WY (KSHR). For each record high reading, using the same Statistics query, the data confirms that the heat dome was in full effect and providing a consistent story for the areas affected:
| Station | Jul 10 | Jul 11 | Jul 12 (peak) | Jul 13 |
|---|---|---|---|---|
| Salt Lake City, UT (KSLC) | 100.4°F | 102.2°F | 109.4°F | 99.0°F |
| Billings, MT (KBIL) | 96.8°F | 104.0°F | 111.2°F | 98.6°F |
| Miles City, MT (KMLS) | 100.4°F | 104.0°F | 114.8°F | 102.2°F |
| Sheridan, WY (KSHR) | 98.6°F | 102.2°F | 109.4°F | 96.8°F |
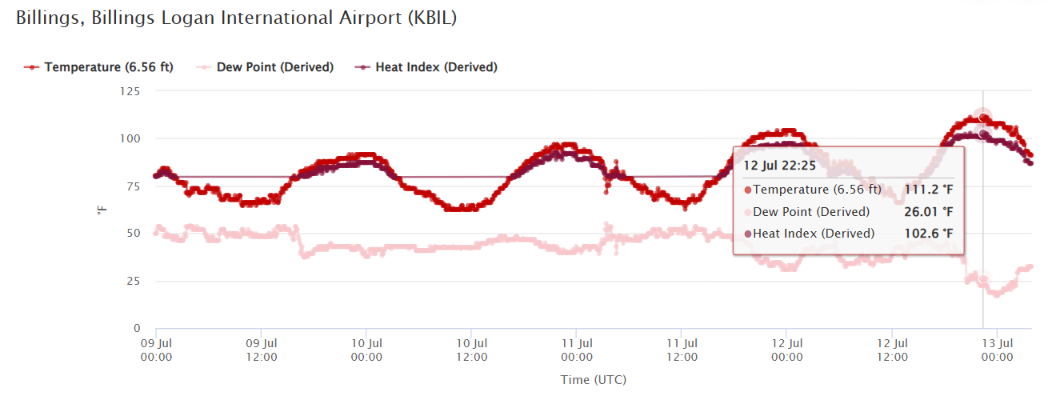
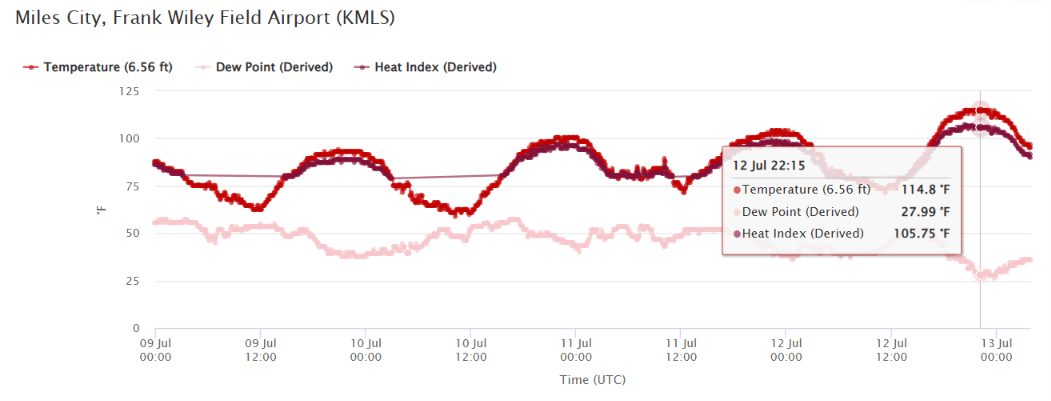
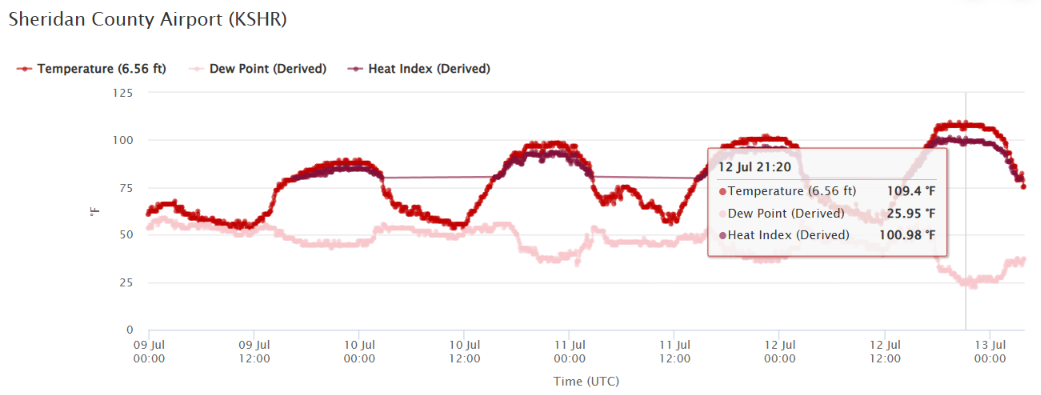
Looking at these four different stations, from four areas of the heat dome, they showcase a clear pattern: two days of building heat, a sharp, synchronized peak on July 12th, then a drop of nearly 10 degrees across each station. Using the Synoptic platform, pulling this data with the Statistics service took only a few easy-to-construct queries, exactly the kind of speed you need when tracking an extreme event as it’s still unfolding.
Analyzing and Acting on Real-time and Historical Observations Using the Synoptic Platform
Using the Synoptic platform to track and analyze weather phenomena, such as this heat dome, provides valuable insights for users, allowing them to take appropriate action for extreme temperatures and understand the impact weather is having on the community. The platform provides both real-time and historical data from a single source, making information available in just a few clicks or queries. The Synoptic Weather API provides fast access to critical insights for surface level conditions in any impacted region. Synoptic’s Statistics and Percentiles services go deeper: the statistics service delivers key data points like daily high and low temperatures, while percentiles show exactly how conditions like temperature, wind gusts, precipitation totals stack up for a station’s period of record.
The next extreme weather event is coming. Having the necessary real-time data and historical context allows you to not only understand what’s happening from moment to moment, but also know how observations compare to decades of history all in one place.