Your Complete Guide to Querying Real-Time and Historical Weather Data with the Synoptic Weather API
The Synoptic Weather API provides access to real-time and historical weather observations from thousands of stations worldwide, delivered in a consistent JSON format. This tutorial is designed for users of all skill levels and covers the core structure of a Synoptic Weather API request, followed by detailed walkthroughs of seven query types: Latest, Time Series, Nearest Time, Precipitation, Statistics, Percentiles, and Metadata. By the end, you should have a clear understanding of how each service works and when to use it.
What Makes the Synoptic Weather API Stand Out?
Before diving into specific queries, it’s worth highlighting some of the capabilities that make the Synoptic Weather API especially powerful for developers, researchers, and operational teams.
Our Weather API provides access to high-quality, real-time and historical observations from thousands of weather stations around the world, all delivered in a consistent and developer-friendly JSON format. Instead of manually collecting data from multiple sources, users can retrieve observations, metadata, and statistical summaries from hundreds of networks and thousands of stations through a single query.
One of the most useful features is the flexibility of our API’s query system. With a single request, you can:
- Retrieve the latest observation from one or many stations
- Pull full time series datasets for analysis or visualization
- Calculate precipitation totals and interval accumulations
- Generate statistical summaries like min, max, and averages for specific time periods with statistics
- Understand how extreme a real-time value is compared to historical data using percentiles
- Access detailed station metadata, including sensors, elevation, and siting history
The API also supports customizable units, quality control flags, and advanced filtering parameters. This makes it easy to tailor responses for dashboards, research workflows, machine learning pipelines, or operational monitoring systems.
Because each service follows a consistent structure, once you understand how one query works, you can quickly adapt that knowledge across Latest, Time Series, Precipitation, Statistics, and other endpoints.
Understanding the Synoptic Weather API Request Structure
To make a request using the Synoptic weather API, users simply need to use the Synoptic Weather API URL, which combines a base endpoint, https://api.synopticdata.com/v2/stations/ a specific service, latest? and a set of query parameters stid=KSLC&token=YOUR_TOKEN. For example, a simple request to retrieve the latest observation from Salt Lake City International Airport combines these into this query:
https://api.synopticdata.com/v2/stations/latest?stid=KSLC&token=YOUR_TOKEN
In this request, the latest service specifies that you want the most recent observation from the selected station. The stid parameter identifies the station itself, while the token parameter provides authentication to access the API.
Optional parameters can be added to refine or expand the request. For instance, the vars parameter allows you to select specific variables to return, such as air temperature, wind speed, or precipitation. The units parameter enables you to choose between metric, English, or custom units for any variable. By default, the obtimezone parameter returns observation times in UTC, but you can set it to local to display the station’s local time.
In short, every Synoptic weather API request follows a clear pattern: Base URL + Service + Parameters. Once you understand this structure, you can include optional parameters to access quality-controlled data, min/max summaries, or historical siting information.
Synoptic also provides users with a query builder, which allows you to enter your parameters and queries in a template format instead of a URL entry. Follow the link below to start building queries and learning the ins and outs of query construction!
Understanding the API Response Format
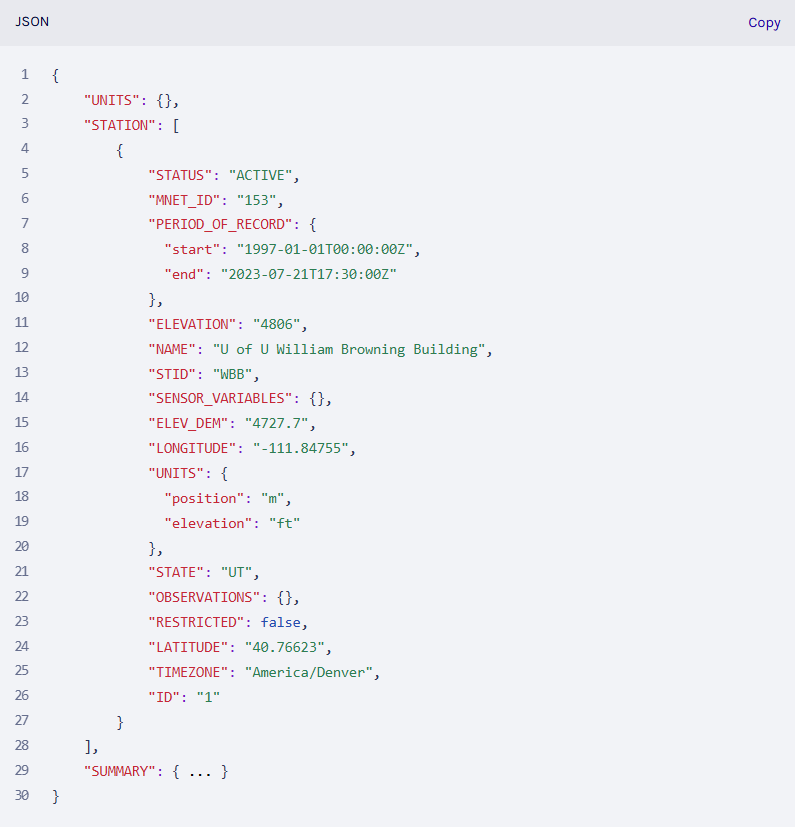
Once you’ve made a query it’s important to be able to effectively utilize the data. Responses from the Synoptic Weather API are returned in XML, CSV, and JSON formats, with the default being JSON. Although the specific content varies by query, most responses contain several consistent sections. For the purpose of consistency this article will focus on JSON outputs. First, the STATION section includes both station-level metadata and the observation data returned by the service. Next, the SUMMARY section provides information about the request status, response messages, processing time, and any access limitations. The UNITS section describes the measurement units for each variable, and finally the QC section indicates whether any observations failed quality control checks or were flagged for review.
Below is an example of JSON output from a Synoptic Weather API Query:
Making Queries
- Latest API Queries Used for Retrieving the Most Recent Observation
Now that we have gone over query construction and output, we can start making some calls to the Weather API, starting with the Latest Service. Latest queries are used to obtain the most recent observation from one or more stations. This service is particularly useful when you need a quick snapshot of current conditions for a specific station. For example, you might use it to display the current temperature or wind speed on a custom dashboard, or to compare the latest observation against historical averages.
Here’s an example query:
https://api.synopticdata.com/v2/stations/latest?stid=WBB&vars=air_temp&units=english&obtimezone=local&token=YOUR_TOKEN
In this query, stid=WBB selects the University of Utah William Browning Building station, while vars=air_temp ensures that only air temperature is returned. Setting units=english displays the temperature in Fahrenheit, and obtimezone=local adjusts the observation time to the station’s local time zone.
There are numerous optional parameters not displayed by the above query which provide additional flexibility when using the latest service! Another unique parameter is the within parameter. Within allows you to restrict results to observations made within the last specified number of minutes. The minmax and minmaxtype parameters enable you to request minimum and maximum values over the previous days, up to seven days before the period indicated. Finally, value_percentile can return the percentile rank of the observation provided by the query, giving users context relative to historical measurements rather than just static values.
The response returned by each query includes metadata about the station, the units of measurement, and of course the observational data for our query which will be found in the OBSERVATIONS section with the most recent readings.
- Time Series: Observations Over a Defined Period
Time Series returns a sequence of observations over a specified time range, making it ideal for analyzing trends or creating visualizations. This service is particularly useful for researchers studying seasonal variations, or meteorologists examining historical weather events.
Here’s an example query for time series:
https://api.synopticdata.com/v2/stations/timeseries?stid=KSLC&start=201501020000&end=201501032359&vars=air_temp&units=english&obtimezone=local &token=YOUR_TOKEN
In this query, the start and end parameters are used to define the time range of observations we are after. Here we can see the start is set for 1/02/2015 at 12:00am UTC. The parameter vars indicate we will get air temperature values for the time series during the period set with the remaining parameters obtimezone and units indicating what time zone will be returned by the output and the type of units being used in the output as well.
The response for a time series query contains arrays of timestamps and aligned observational values, making it easy to plot temperature trends or analyze patterns programmatically.
- Nearest Time: A Snapshot at a Specific Moment
Nearest Time queries retrieve the observation closest to a specific timestamp. This is particularly useful when you need an exact reading for a specific event at a specific time. For example, you might want the temperature closest to the start of a public event or a specific time for a research measurement. Nearest Time will return the closest reading to the indicated time for the units selected.
Here is an example query for Nearest Time:
https://api.synopticdata.com/v2/stations/nearesttime?stid=KSLC&attime=201501021800&within=60&vars=air_temp&units=english&obtimezone=local &token=YOUR_TOKEN
Here we can see the within parameter restricts results to a defined window around the target time. The API response for Nearest time queries include station metadata, quality control information, and of course the nearest observation, making it ideal when a single, precise data point is required.
- Precipitation: Accumulated Totals and Intervals
The Precipitation Service (a value-add service) available via the Synoptic Weather API provides derived precipitation totals and interval accumulations over a defined period. This service is especially useful for hydrologists, emergency managers, researchers and those interested and or in need of rainfall data.
Here is an example query for Precipitation:
https://api.synopticdata.com/v2/stations/precip?stid=WBB&start=201701010000&end=201702010000&pmode=intervals&interval=day &token=YOUR_TOKEN
In this request, we can see the query type used precip, the station used is WBB, or William Browning Building, a start and end value is given in the format YYYYMMDDTTTT, which is populated with January 1st, 2017 as a start and February 2nd, 2017 as an end for the period of time which precipitation data will be retrieved. pmode=intervals returns precipitation totals for each observation interval, while interval=day specifies daily accumulations will be returned by the request. Alternative modes include pmode=totals, which returns a single accumulation for the entire period, and pmode=last, which provides an accumulation ending at a specific time.
The response for precipitation queries includes precipitation values for each interval, along with metadata such as the number of observations used and quality control indicators.
- Statistics: Minimum, Maximum, and Average Values Aggregated and Ready for Use
Statistics, another value-add service for the Weather API, summarizes observations by returning minimum, maximum, and average values over a specified period. This service is useful when you need a concise overview of conditions without inspecting every individual observation over a time period.
Here’s an example query for Statistics:
https://api.synopticdata.com/v2/stations/statistics?stid=KSLC&vars=air_temp&period=day&start=20250101&end=20250103 &token=YOUR_TOKEN
Here we can see the service used is statistics, the station chosen is KSLC Salt Lake City International Airport, and period=day specifies daily aggregation for the data. The start and end parameters indicate the time period for the data to be collected, with this query focusing on January 1st, 2025 to January 3rd, 2025.
The response for statistics queries provide daily minimum, maximum, and average temperatures along with timestamps, making this service ideal for reporting, climatological summaries, or operational analysis for specific periods of time
- Percentiles: Understanding Extremes and Rarity
Percentiles is a value-add service that returns percentile distributions for selected variables, helping users understand how extreme or rare certain observations are relative to historical data.
Here’s an example query for the percentiles service:
https://api.synopticdata.com/v2/stations/percentiles?stid=KSLC&vars=air_temp&percentiles=1,5,10&period=day&start=20250101&end=20250201&obtimezone=local &units=english&token=YOUR_TOKEN
The query above shows that the percentiles service is utilized, with stid selecting station KSLC. vars selects air_temp as it has for all previous queries, and we see a new parameter here, percentiles. The percentiles parameter allows users to define which percentile data they would like to be returned for a specific period. Next period = day defines the aggregation of the percentiles, this can be from day week month to even yearly aggregation of percentile data. Next the query gives a start and end parameter of January 1st 2025 to February 1st 2025, with local time zone and Fahrenheit to be used for the queries output. based on the full period of record or on daily minimum and maximum values. The response contextualizes observations by showing thresholds that only a small percentage of historical values fall below or above.
Percentiles are particularly useful for identifying extreme weather conditions, evaluating risk thresholds, or placing recent observations in historical context.
- Metadata: Exploring Station Details
The Metadata service returns detailed information about weather stations, including location, elevation, sensors, available variables, and operational history.
Here is an example query utilizing the meta data query type:
https://api.synopticdata.com/v2/stations/metadata?stid=KSLC&complete=1&sensorvars=1&obrange=20250101,20250131&output=json &token=YOUR_TOKEN
The query structure again indicates that metadata is used, KSLC is selected with stid, but we see some parameters totally unique to metadata queries. First, using complete=1 ensures full station metadata is returned, while sensorvars=1 includes sensor and variable details. Finally, obrange sets the time period that the meta data will be acquired for.
Metadata queries are essential for validating observations, integrating station data into geospatial applications, and understanding the context behind weather measurements.

The Synoptic Weather API offers a powerful and flexible foundation for accessing real-time and historical weather data. With services such as Latest, Time Series, Nearest Time, Precipitation, Statistics, Percentiles, and Metadata, users can move beyond individual observations and gain deeper insight into weather patterns and trends.
Whether you’re building dashboards, conducting research, or supporting operational decision-making, the Synoptic Weather API provides the tools needed to turn high-quality weather observations into actionable information.
For further reference, see the full documentation or use the query builder to experiment with requests interactively.