How Synoptic Data Ensures Our Users are Working With Weather Data They Can Trust

In a world increasingly impacted by weather events, the accuracy of the data behind every forecast, alert, and model matters more now than ever. A single erroneous temperature reading can skew a forecast model or mislead operations teams. At Synoptic, we believe data quality isn’t an afterthought, it’s a foundational requirement. That’s why we apply a comprehensive suite of Quality Control checks in real-time to every observation that flows through our platform, ensuring our users get the most accurate data possible.
Why Quality Control is Vital When Working With Raw Weather Data
The inherent hurdle when working with raw weather data is simple: surface weather observations come from thousands of stations operated by hundreds of different networks. With that scale comes variability, sensor failure, corrupted data, or transmission errors that creep in. The result is that raw data, no matter how well-intentioned or reliable the source, routinely contains values that are implausible. Synoptic’s approach to wrangling the variability of raw data is a comprehensive set of checks from multiple sources, which are applied systematically across all data, regardless of origin.
Synoptic’s Solution: A Multi-Layered QC Framework
Synoptic’s QC system is organized into two tiers, each catching a different class of data problems. The first catches clear cut errors, those that are physically impossible, and the second tier, which identifies subtler anomalies that only become visible with historical and spatial context.
Basic QC is the first line of defense. It includes numerous checks designed to catch the most common errors. Basic QC checks are grounded in known physical relationships (e.g. range, rate, and persistence thresholds) and have defined WMO standards. Basic checks use comparisons of single-variable observations to thresholds or inter-variable comparisons for a single station.
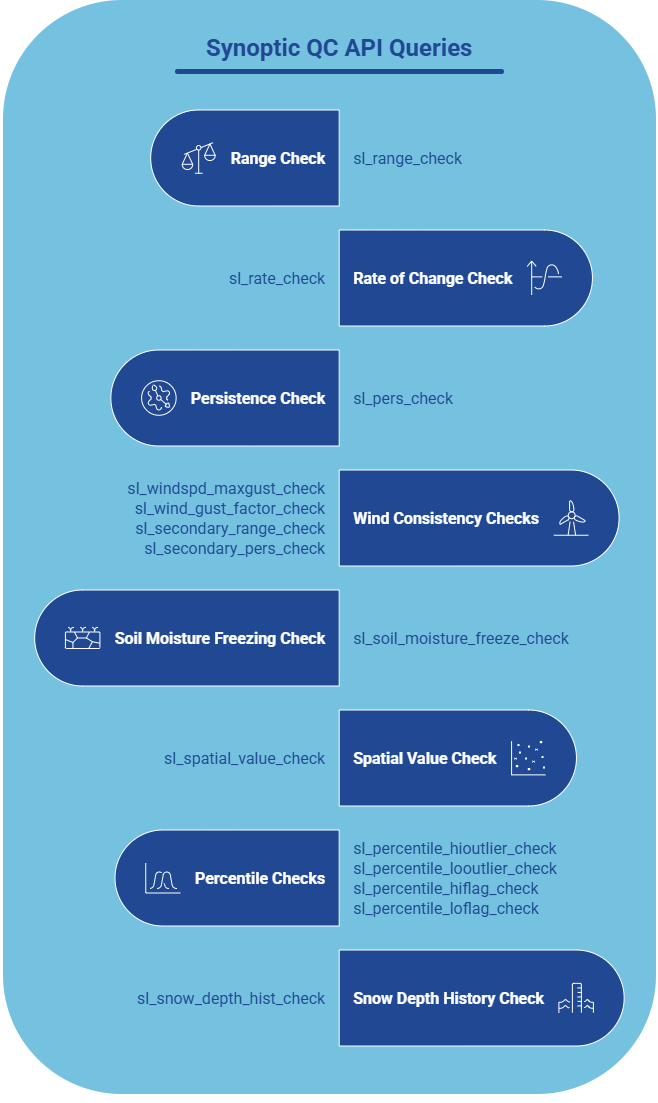
Synoptic’s Basic Quality Control Checks:
- Range Check (sl_range_check) is the gatekeeper for Synoptic’s Quality Control. It identifies physically implausible values, for instance, an air temperature of 65°C (145°F) or a wind speed exceeding 103 m/s (230 mph), using validated min/max thresholds for over 100 meteorological variables. No further checks are run on a value that fails this range check; once it gets flagged, it’s designated in our system and indicated to the user. By default, the Synoptic Weather API automatically applies this check and filters flagged data from every response.
- The Rate of Change Check (sl_rate_check) analyzes whether a jump between two consecutive observations is realistic. A pressure swing of 925 Pascals (9.25 MB) in five minutes, or a temperature spike of 5° in the same window, gets flagged.
- The Persistence Check (sl_pers_check) catches stuck sensors. If a temperature sensor reports the exact same value every 15 minutes for 24 hours, that’s almost certainly a hardware failure, not a remarkably stable atmosphere. Each variable has its own window and minimum expected range. For example, wind direction must vary by at least 2.5 degrees over 24 hours to pass.

- The Wind Consistency Checks (sl_windspd_maxgust_check, sl_wind_gust_factor_check, sl_secondary_range_check, sl_secondary_pers_check) work together to validate the physical relationship between wind speed and wind gust. If the reported wind speed exceeds the gust, both are flagged. If the gust-to-speed ratio is implausible, the gust is flagged. And because wind speed and gust are typically reported from the same sensor, problems with one cross-flag the other.
- The Soil Moisture Freezing Check (sl_soil_moisture_freeze_check) flags soil moisture when soil temperature is < 0°C.
Advanced QC goes further, using context, both spatial and historical, to identify observations that may be physically plausible in isolation but are outliers in practice. Advanced QC checks leverage other derived datasets (e.g. historical percentiles, gridded products), or spatial comparisons with neighboring stations. Synoptic’s advanced checks represent years of R&D and optimization for real-time performance.
- Spatial Value Check (sl_spatial_value_check) compares a station’s observation against the nearest-in-time values from neighboring stations within 30 km and 200 meters elevation. For air temperature, a discrepancy of 10°C or more from the neighborhood median triggers a flag. This check applies to Synoptic’s core variables: altimeter, air temperature, dew point temperature, relative humidity, wind speed, wind gust, and pressure.
- The Percentile Checks apply to air temperature specifically, using each station’s own historical record (minimum three years of continuous data) to define what is normal. The outlier checks (sl_percentile_hioutlier_check, sl_percentile_looutlier_check) flag values that exceed the station’s 99.5th or 0.5th percentile by a significant margin; these are values likely to be erroneous. The flag checks (sl_percentile_hiflag_check, sl_percentile_loflag_check) identify observations near the historical extremes that may represent genuinely exceptional weather. These flag checks are deliberately excluded from the default QC suite so that historically significant observations are never automatically removed.
- The Snow Depth History Check (sl_snow_depth_hist_check) compares current snow depth observations against a median of multi-day snow depth history.
Finally, MesoWest and MADIS checks are independent from both Synoptic’s Advanced Quality Control and Basic Quality Control and provide additional spatial analysis. These checks include a multivariate linear regression check, a 24-hour wind persistence check, and the UU2DVAR rejection check, which compares observations against gridded surface meteorological fields.
Using QC in the API and Data Viewer
For users of the Synoptic Data Weather API, QC is both transparent and configurable. By default, every API call to the timeseries, latest, and nearesttime endpoints applies the range check and filters flagged data automatically. Synoptic’s users don’t have to do anything to get a baseline level of quality control other than use the services.
However when you need more strict quality control, four API parameters let you customize behavior:
- qc=on activates the full QC system, returning a QC_SUMMARY object and attaching QC flags to individual observations.
- qc_remove_data determines what happens to flagged values, you can remove them (on), keep them (off), or mark them as false for downstream handling (mark).
- qc_flags=on returns the specific check names that triggered alongside each flagged value.
- qc_checks lets you specify exactly which checks to run, whether by individual flag name, by provider, or by keyword (basic, advanced, synopticlabs).
For most use cases, using qc_checks=synopticlabs in the API is an excellent starting point. It applies the full suite of Synoptic’s Basic and Advanced checks while deliberately excluding the more aggressive checks that could inadvertently remove valid extreme observations.
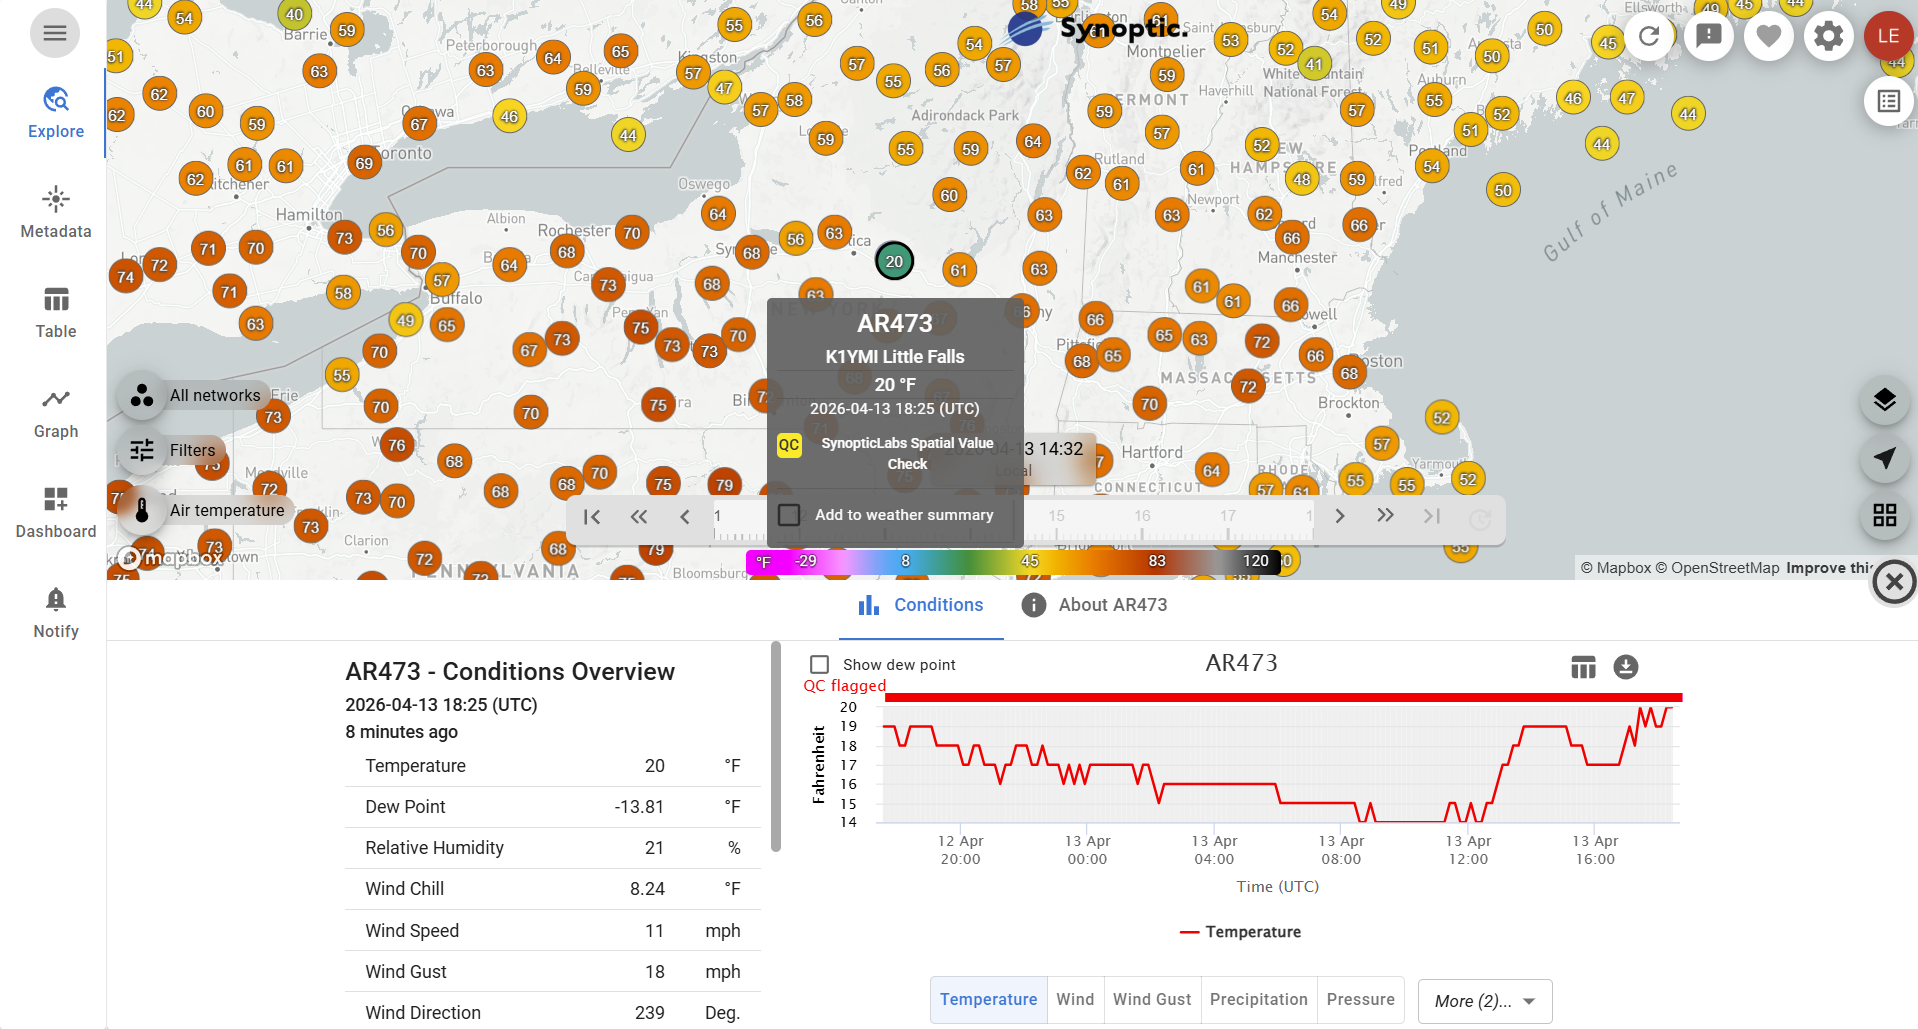
The Synoptic Data Viewer gets the same state-of-the-art Quality Control services. When utilizing the Data Viewer, values are flagged using the above quality control initiatives and will have indicators such as a black ring around map markers for Quality Controlled observations, a “QC Flagged” indicator when viewing a station specifically, and a QC icon will appear when hovering over a station which has been flagged as an erroneous value.
What QC Can and Cannot Do
While Synoptic’s QC is powerful, quality control algorithms have their limits. QC checks can significantly reduce erroneous observations, but no automated system catches everything, and no system should be configured so aggressively that it removes genuinely unusual, but valid, data.
The Bottom Line
Whether you’re forecasting, building a new application, powering weather analytics, conducting scientific research, or simply viewing current conditions, access to quality controlled data provides better situational awareness and improves the products and services you’re providing. At Synoptic, our commitment to data quality is ongoing, with continuous research and development focused on bringing new Quality Control checks to our already state-of-the-art processes. To learn more about Synoptic’s quality control or find the latest update on the service, go to our website: https://synopticdata.com/value-add-services/quality-control/
To explore the full documentation go to: https://docs.synopticdata.com/services/mesonet-data-qc#SynopticDataQC-BasicQC
Have any questions? Reach out to us directly to discuss the right QC configuration for your use case: https://synopticdata.com/contact-us/