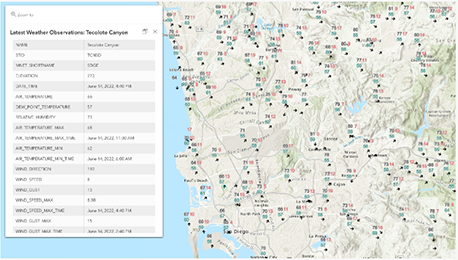
Synoptic’s Weather API is a powerful tool designed to provide seamless access to real-time and historical weather and environmental data, enabling organizations to make informed decisions based on reliable and timely information.
With the Synoptic Weather API, you can access observations from over 170,000 public and private stations, over 320 networks worldwide, and 160 variables.

Gain entry to an extensive database of weather observations from hundreds of thousands of stations worldwide, covering a wide range of atmospheric and environmental variables.

Stay informed with up-to-the-minute weather data, ensuring your operations are based on the latest weather conditions.

Analyze past weather patterns with ease, accessing historical data to support research, trend analysis, and predictive modeling.

Trust in the reliability of your data with Synoptic’s rigorous quality control processes, which include basic and advanced checks to identify and flag potential anomalies.

Easily incorporate weather data into your existing systems and applications through our weather API, which supports various query parameters and output formats to suit your specific needs.
Choose one or more of our additional Weather API services to help streamline your operations


Below are examples of how the Weather API can be used to obtain a specific request.
Using the timeseries service, we build a query to retrieve the past 7 days of air temperature and heat index data from ASOS stations (network=1) located in Travis County, TX, which includes Austin.
The request returns a 7 day timeseries of air temperature and heat index for the 4 ASOS stations in Austin TX in units of Fahrenheit: units=temp|F
https://api.synopticdata.com/v2/stations/timeseries?network=1&state=TX&county=travis
&vars=air_temp,heat_index&recent=10080
&units=temp|F&token=<token>
Variables
network=1
state=TX
county=Travis
vars=air_temp,heat_index
recent=10080
Output
<Real Output> in Script
Using the latest API service, we can build a query to retrieve road temperature data from stations in Oregon, Washington, and Idaho that have reported within the past 90 minutes.
The request returns observations from 310 stations in station-local time:
obtimezone=local
https://api.synopticdata.com/v2/stations/latest?state=OR,WA,ID&vars=road_temp&within=90&obtimezone=local&token=
Variables
state=OR,WA,ID
vars=road_temp
within=90
Output
in Script
Using the precipitation service, we can build a query to retrieve total precipitation values from stations within a 25-mile radius of Asheville (35.5975° N, 82.5461° W) for the period of September 25 to 28, 2025.
The request returns 217 stations, some reporting more than 24 inches of precipitation along with precipitation totals in units of inches:
units=precip|in
https://api.synopticdata.com/v2/stations/precip?radius=35.5975,-82.5461,25&pmode=totals&start=202409250000&end=202409280000&units=precip|in&token=
Variables
radius=35.5975,-82.5461,25
pmode=totals
start=202409250000
end=202409280000
Output
in Script
Using the metadata service, we can build a query to identify active stations in Montana that report soil moisture observations.
The request returns 210 stations and will also limit the API return to only the station name, station id, and elevation attributes:
fields=stid,name,elevation
Variables
state=MT
vars=soil_moisture
status=active
Output
in Script
If you have specific needs and want to learn more about our pricing options, you can contact our sales team. Our team is ready to assist you in adding these powerful tools into your operations, ensuring you have the accurate and timely weather data necessary to drive your organization’s success.