At Synoptic, we begin with heavy hearts, mourning the lives lost and the immense suffering caused by the devastating floods that struck the Texas Hill Country on July 4, 2025. Our thoughts and prayers are with the families, loved ones and all affected by this tragedy.
What should have been a day of joy, family gatherings, and celebration turned into a nightmare. Torrential rain and rapidly rising rivers swept through campsites, homes, and roads leaving devastation in their wake. Among the hardest hit were families camping along the Guadalupe River, many of whom were caught off guard by how swiftly conditions deteriorated.
To the families who lost loved ones, to those still recovering from injuries and displacement, and to all who are grieving, we extend our deepest condolences from the bottom of our heart. Your pain is felt far beyond the riverbanks.
We also pay tribute to the heroic efforts of first responders, local officials, volunteers, and everyday citizens who risked their lives to help others. Their courage amid chaos and heartbreak saved lives and brought hope in the darkest hours.
As we reflect on this tragedy, we do so not just to recount what happened, but to listen to what the data revealed. The environmental and river monitoring systems that recorded this flood offer valuable insight, not to minimize the loss, but to learn from it. By understanding the warning signs that unfolded in real-time, we can better prepare, respond, and protect lives in the future.
This article will not focus on forecasts or outcomes, but on how the data evolved.
Capturing the Storm: Observations Told the Story
Rainfall rates surged in a short period of time in the area upstream from the devastation, and radar-estimated rainfall totals in a concentrated area near Camp Mystic approached or exceeded 10 inches in 12 hours. The scale and speed of the river’s response reflect not only the volume of precipitation but also how the riverbed transformed quickly. In the afternoon of July 3, the Guadalupe River, including the North and South Forks, was flowing normally. But with massive rainfall in a short time, this riverbed was not capable of containing that much water.
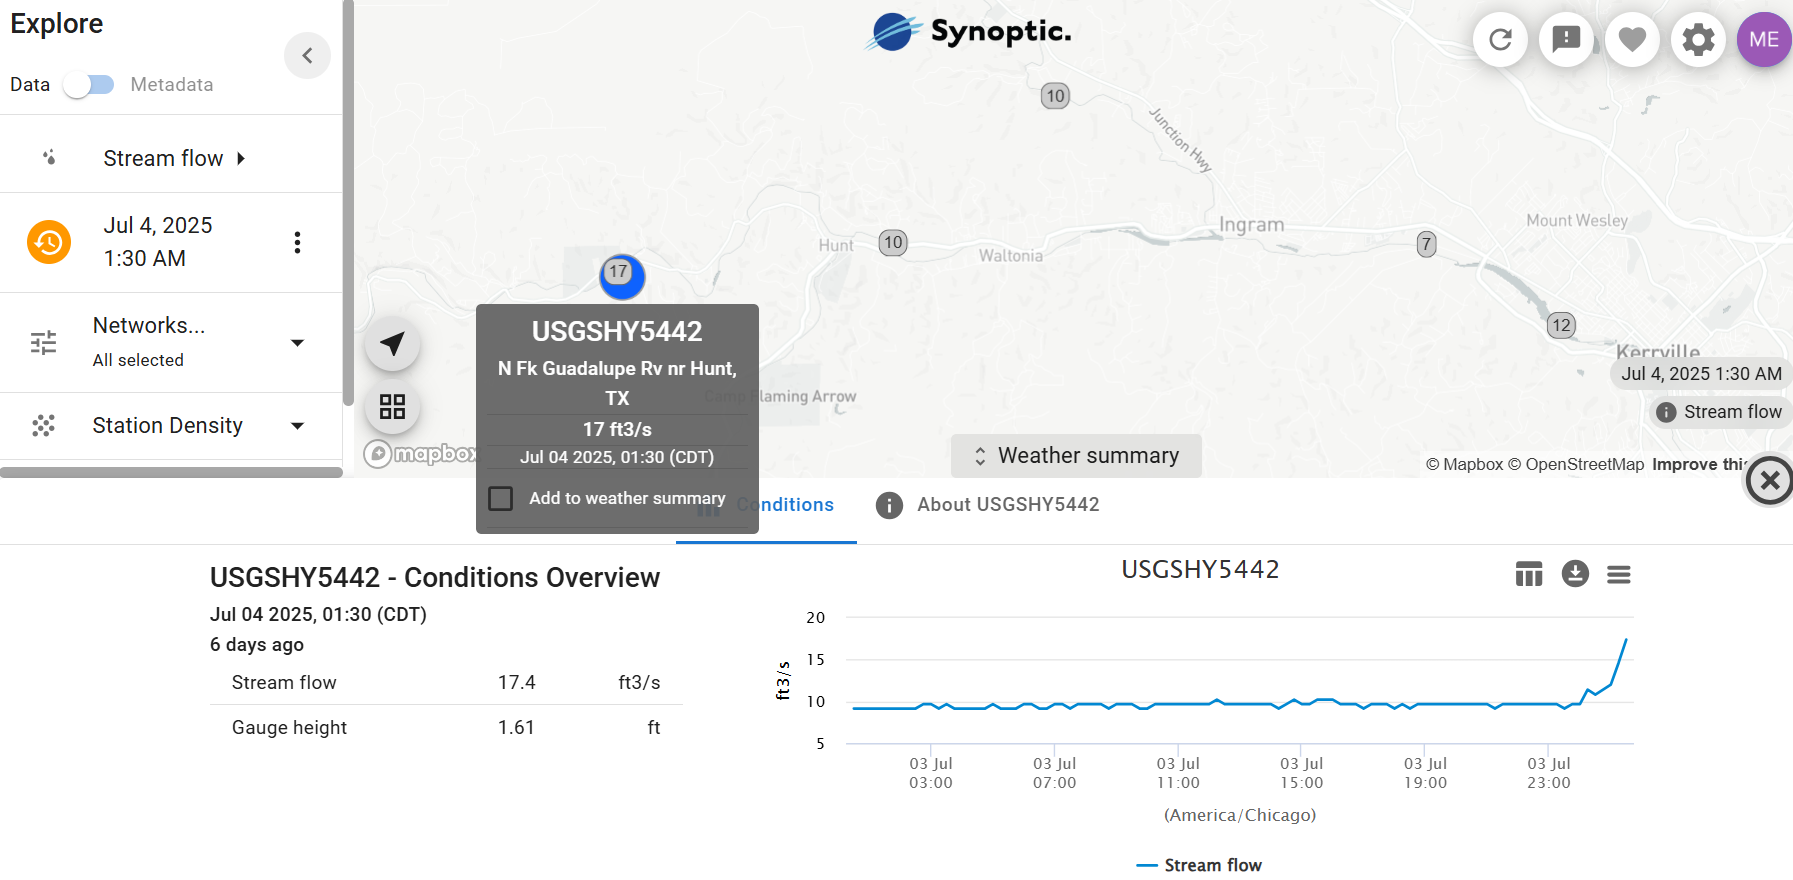
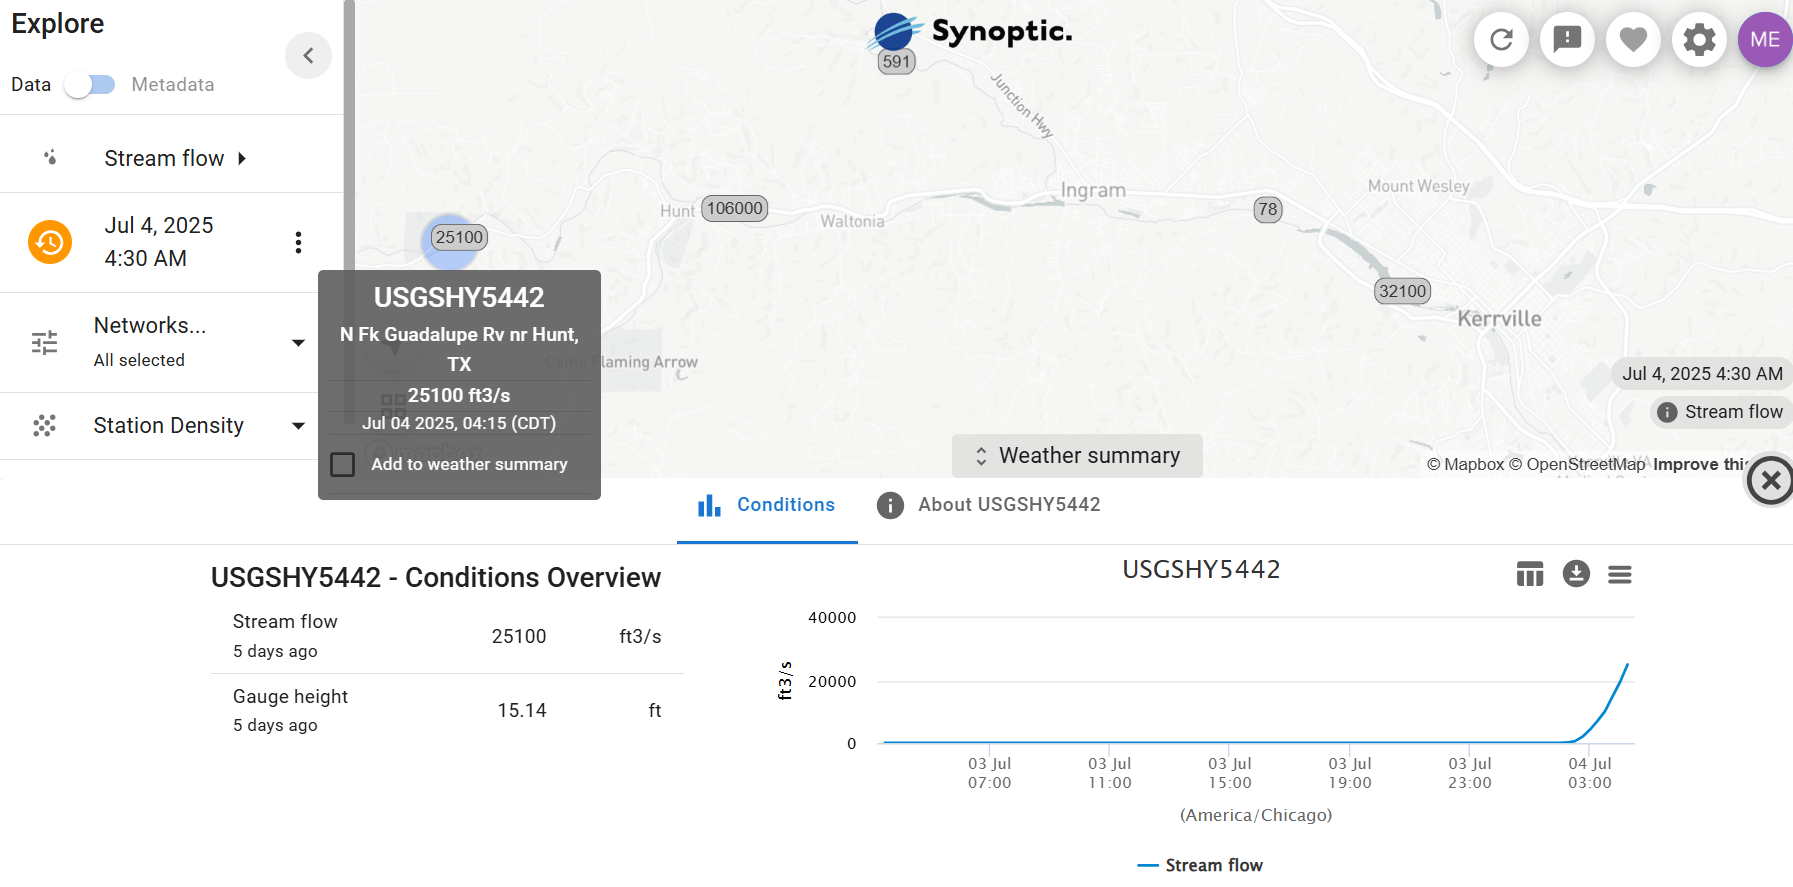
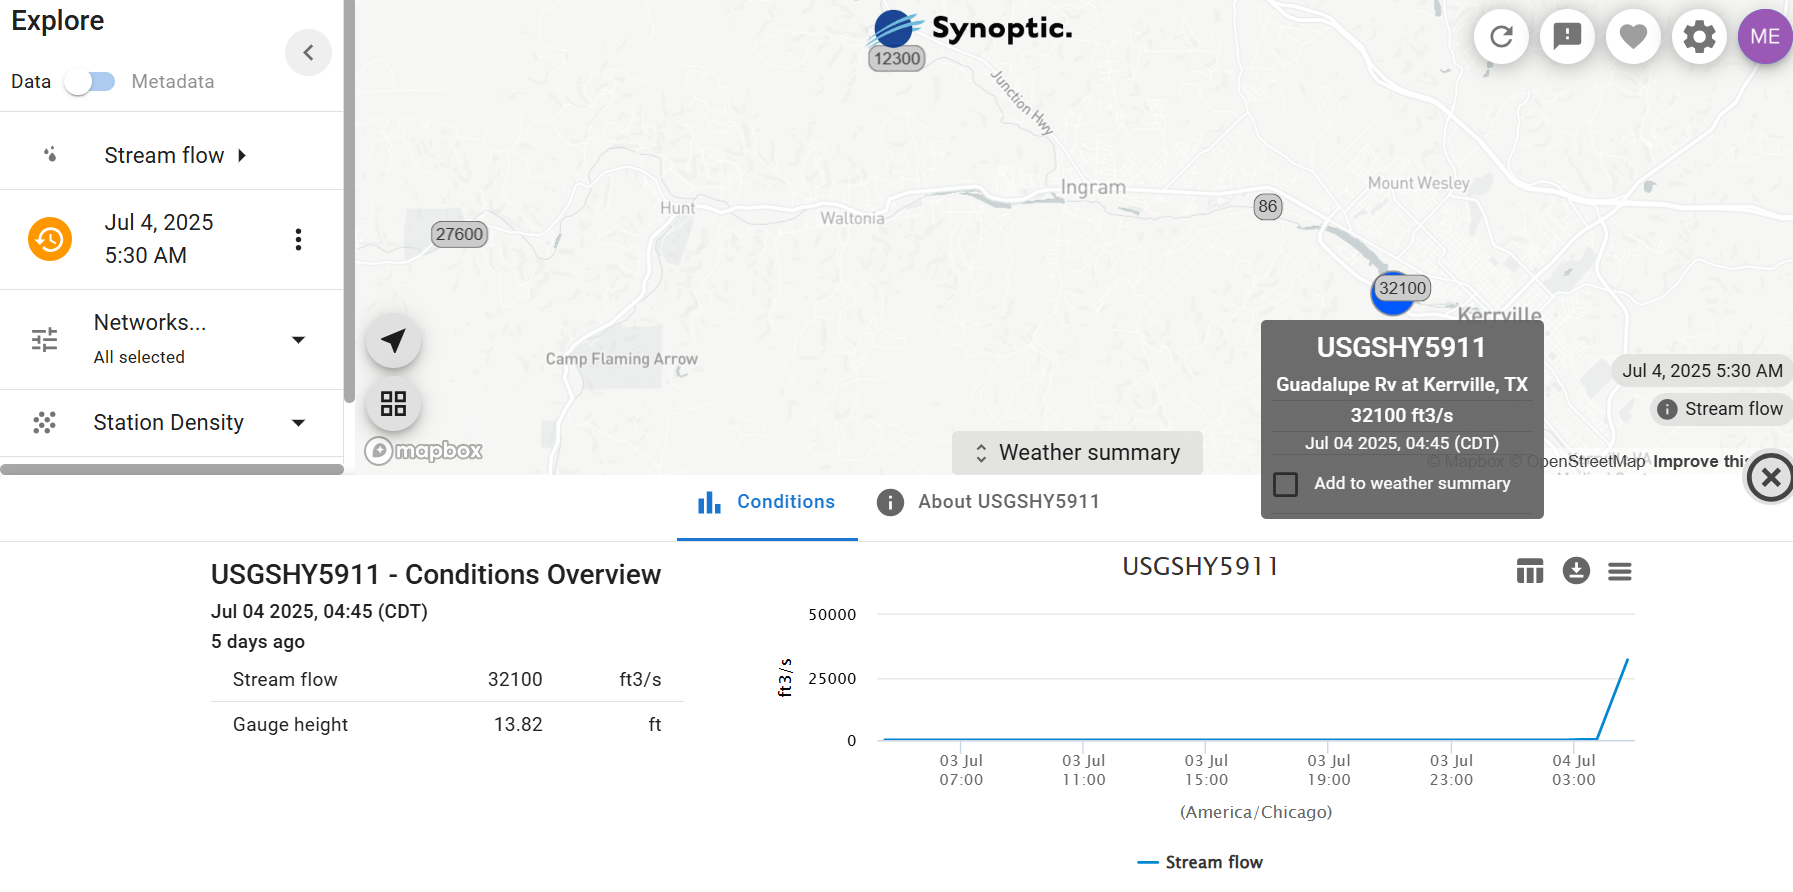
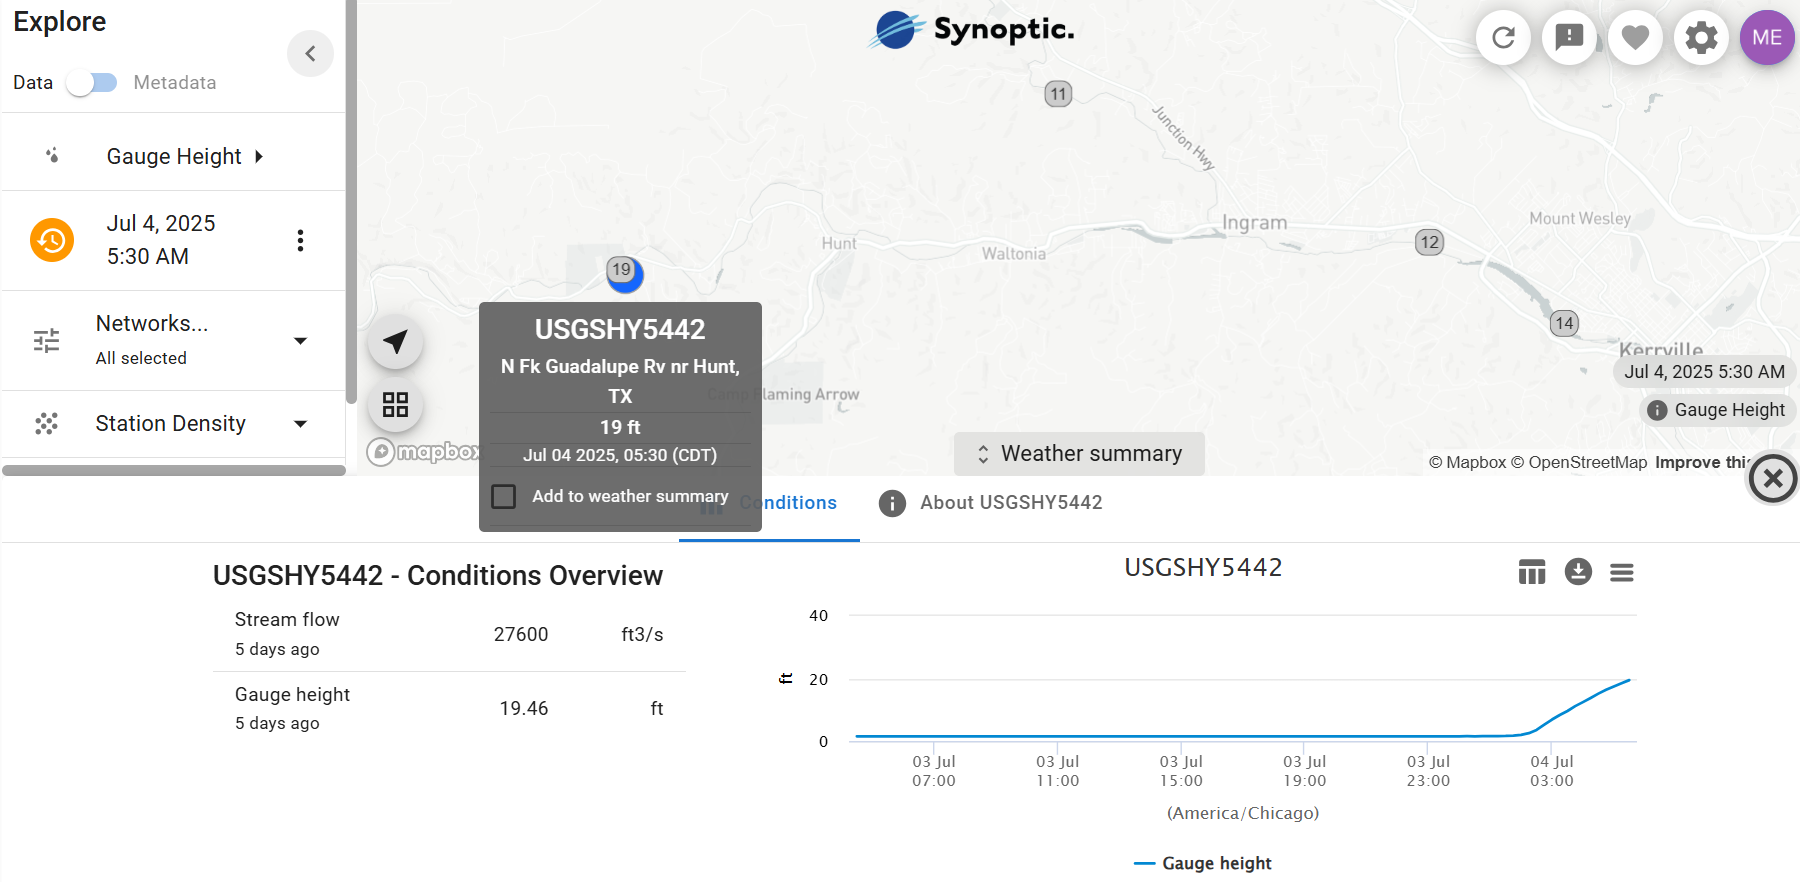
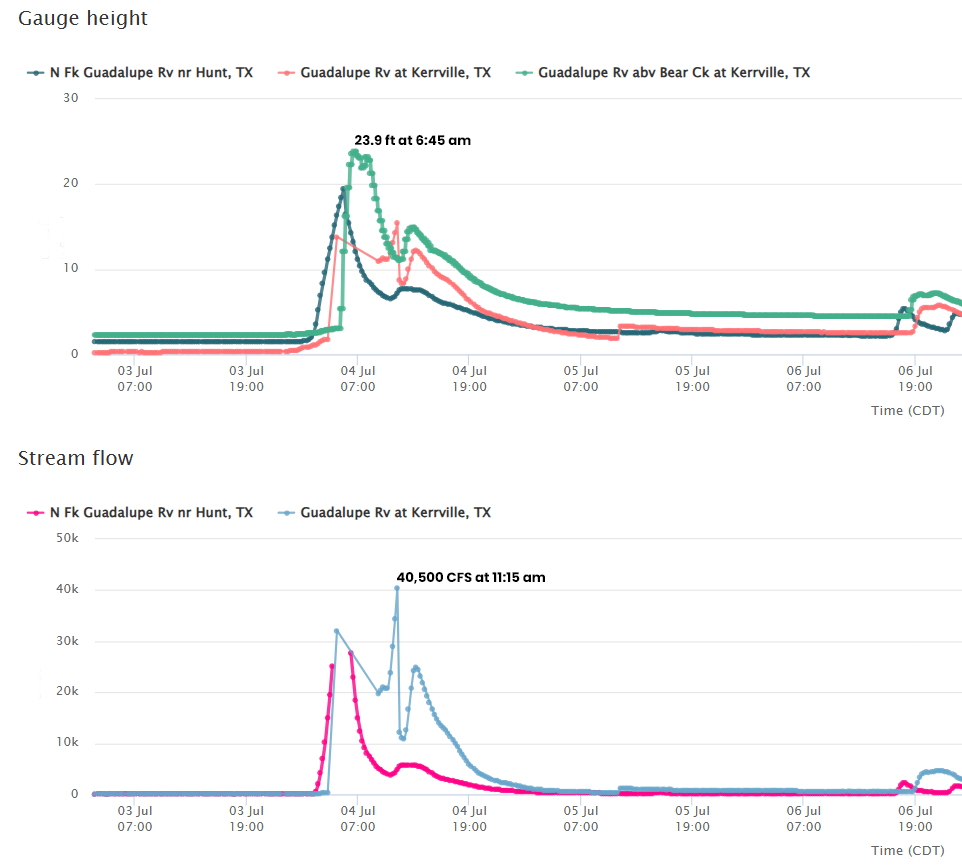
Real-time data from stations in the area captured this acceleration. Figures 1 and 2 show stream flow data at 1:30 am and again at 4:15 am at a USGS station west of the confluence of the North and South Forks of the Guadalupe River. The stream flow surged from 17 cubic feet per second (CFS) to over 25,000 CFS in a span of 3 hours. The USGS station at Hunt, Texas at 4:30 am was reporting 106,000 CFS. Looking further east along the river, north of Kerrville, Texas, stream flows went from 12 CFS at 1:30 am to 32,100 CFS by 4:45 am (Figure 3).
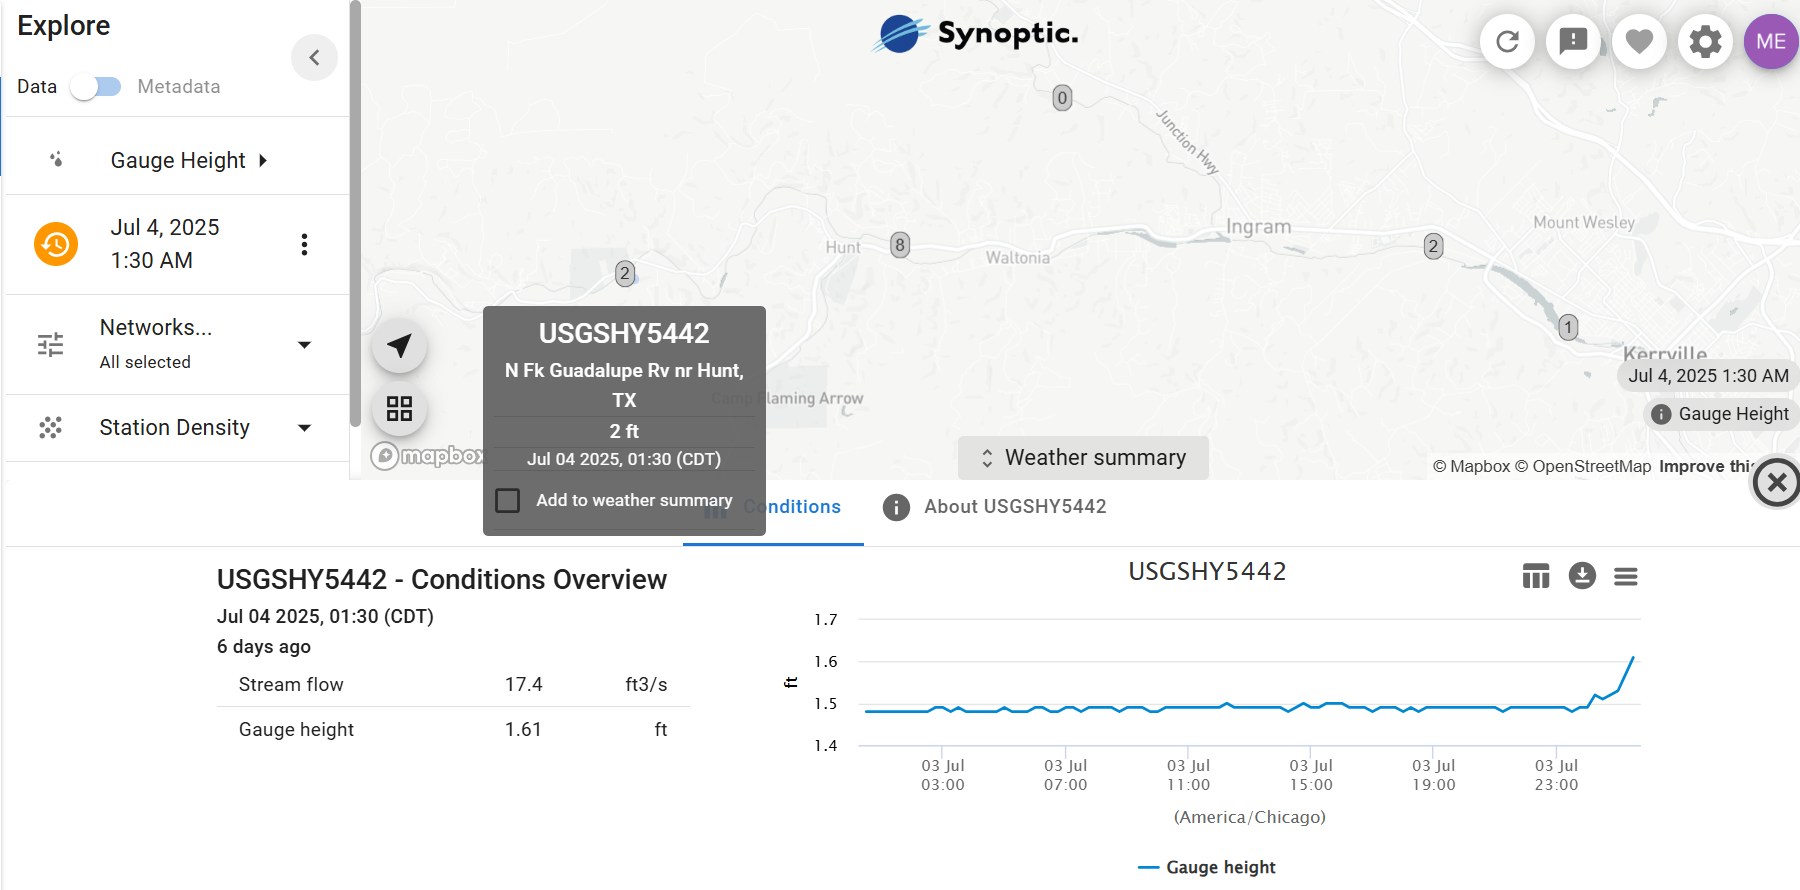
At a USGS river gauge along the North Fork of the Guadalupe River, gauge height data jumps from 2 to over 19 feet in a 4 hour timeframe (Figures 4 and 5). The station near Hunt, Texas went offline, indicating a problem. The data was showing the rapid increase and deteriorating conditions. At one critical stream gauge, stage height increased more than 4 feet in less than an hour. The data was a telling story.
In several locations, rainfall accumulation jumped from less than half an inch per hour to nearly three inches per hour in 60 to 90 minutes. Figure 7 provides hourly data from a Texas Water Development Board station, which is located in the Kerr Wildlife Management Area north of the North Fork of the Guadalupe River.
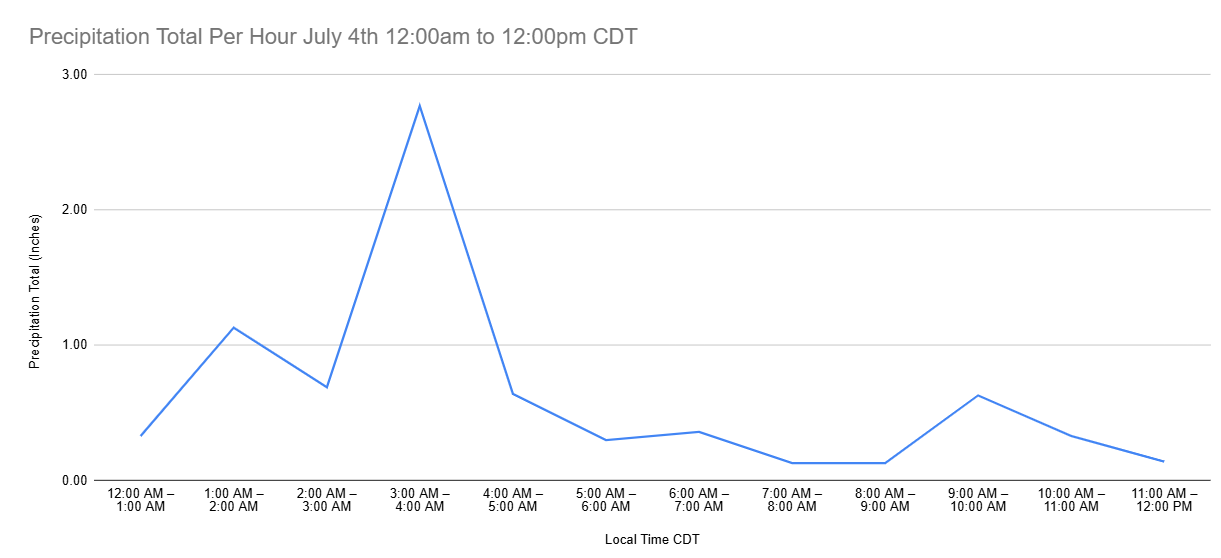
The data showed how quickly changes were happening and how challenging of a situation it became.
Data in Motion: Supporting Forecasts and Local Awareness
Real-time data plays a critical role for meteorologists, especially during flash flood events. As rainfall rates intensify and water levels rise, forecasters rely on these observations to verify radar estimates, monitor local conditions, and issue or update warnings. Local data from diverse networks help distinguish between nuisance flooding and life-threatening conditions, often in the narrow windows where action can make a difference.
At the same time, these data networks serve the community, such as local emergency managers, and everyday users, such as campground staff. During this tragic storm, real-time monitoring of environmental conditions proved vital, and contributed directly to life saving decisions. These observations serve as a critical complement to traditional tools like watches, warnings, and forecasts. The ability to track rising rainfall totals minute by minute empowers community leaders and all of those impacted to act with precision under extreme pressure. As we grieve those who were lost and face the aftermath of these floods, we can begin to take steps toward better understanding and preparing for unexpected weather events like this one.
Post storm, the observation data are helping local officials, researchers, and emergency planners better understand the storm. Historical data are being used to reconstruct timelines, validate impacts, and identify vulnerabilities.
What’s Next?
The July 4th flooding in Texas serves as a stark reminder: fast-developing events require informative, reliable data. Real-time environmental observations, especially from local stations, are vital for immediate response. As post-storm analysis continues, these data will help paint a more complete picture of what happened, how it happened, and how we can better prepare for the future.