|
|
|
|
Why Quality Control Matters More Than You Think |
|
Behind every forecast, dashboard, or weather model is a massive stream of raw observations — and not all of it is perfect. From sensors that are not reporting to unrealistic values, bad data can quietly creep in and impact downstream decisions.
We break down how Synoptic’s quality control framework works behind the scenes, from basic range checks to more advanced spatial and historical analysis. If you’ve ever wondered how Synoptic balances filtering bad data without losing meaningful outliers, read our latest blog post to learn more about our approach to quality control. |
|
|
|
|
|
Integrating Weather Data with Esri ArcGIS Velocity |
|
As an Esri Partner, Synoptic makes it easy to bring real-time weather data directly into your geospatial workflows.If you’re already using ArcGIS, Esri’s GIS platform, Synoptic’s Weather API can be integrated with ArcGIS Velocity, making it easy to stream real-time weather observations directly into your ArcGIS environment.
|
|
|
|
ArcGIS Velocity is designed for real-time data ingestion, processing, and analytics. The integration with data from Synoptic allows you to visualize current conditions, perform analytics in real-time, and build more dynamic, event-driven workflows within ArcGIS. Whether you’re monitoring field assets, supporting daily operations, or responding to rapidly changing weather, integrating Synoptic’s real-time observations with ArcGIS Velocity’s geospatial tools adds valuable context where and when it matters most.
It’s a flexible way to extend the value of your existing ArcGIS investment—and another way Synoptic helps you get more out of the platforms you already rely on.
|
|
|
|
|
|
|
|
Product Spotlight: Visualizing Wind Gust Extremes in the Data Viewer |
|
We’ve added a new way to monitor wind conditions in the Synoptic Data Viewer by bringing our Percentiles API service directly into the platform. Statistics & Percentiles is a value-added service that enhances data analysis by providing on-demand statistical insights for any weather station in the network if the station’s period of record is greater than one year.
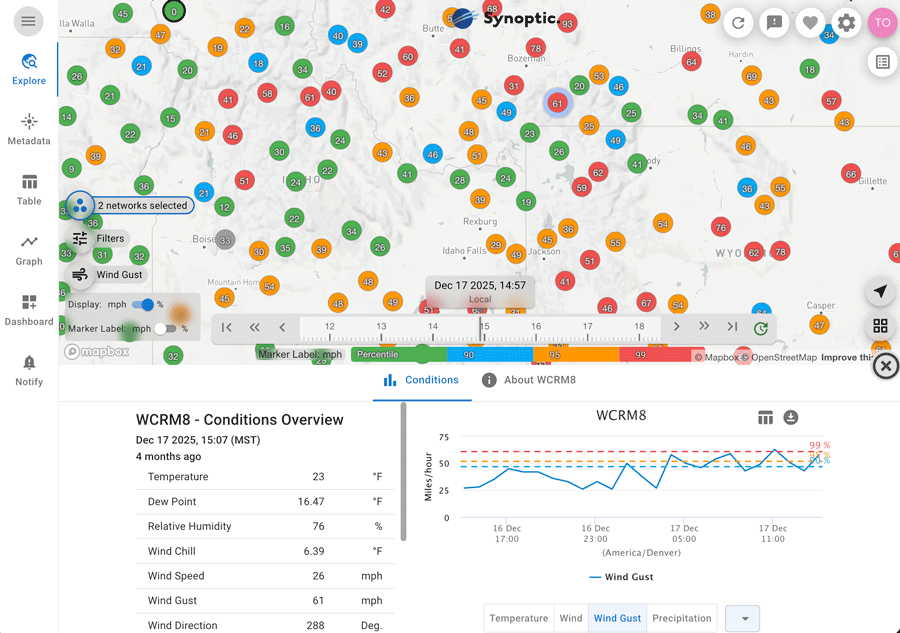
We have started by integrating wind gust percentile support into the Data Viewer. Observed wind gusts can now be displayed relative to each station’s historical gust distribution. Color coding station markers based on the percentile distribution eases interpretation of severity across spatial regions, and the addition of percentile thresholds on timeseries plots adds important context when monitoring trending wind behavior. Together, this makes it easy to move beyond raw values and quickly understand how impactful current conditions really are. For example, a gust that might seem routine in one region can immediately stand out as significant in another when viewed in percentile space. |
|
|
|
Wind gust observations during a historic December 17, 2025 wind event in the Intermountain West. Station map markers are color coded according to the wind gust magnitude in each station's percentile space. Thresholds are established at 90%, 95%, and 99%. Marker labels refer to the wind gust value in mph.
|
|
This feature is built on a deep historical archive, with thousands of stations offering decades of data to provide meaningful context. Instead of asking “how strong is the wind?”, users of this service can now ask “how extreme is this compared to what’s normal here?” The data provides a critical distinction for applications like wildfire risk, infrastructure monitoring, and operational decision-making. By combining real-time observations with continuously updated percentile calculations, the Percentiles service offers a faster, more intuitive way to assess the scale and impact of wind events as they unfold.
|
|
|
|
|
|
|
|
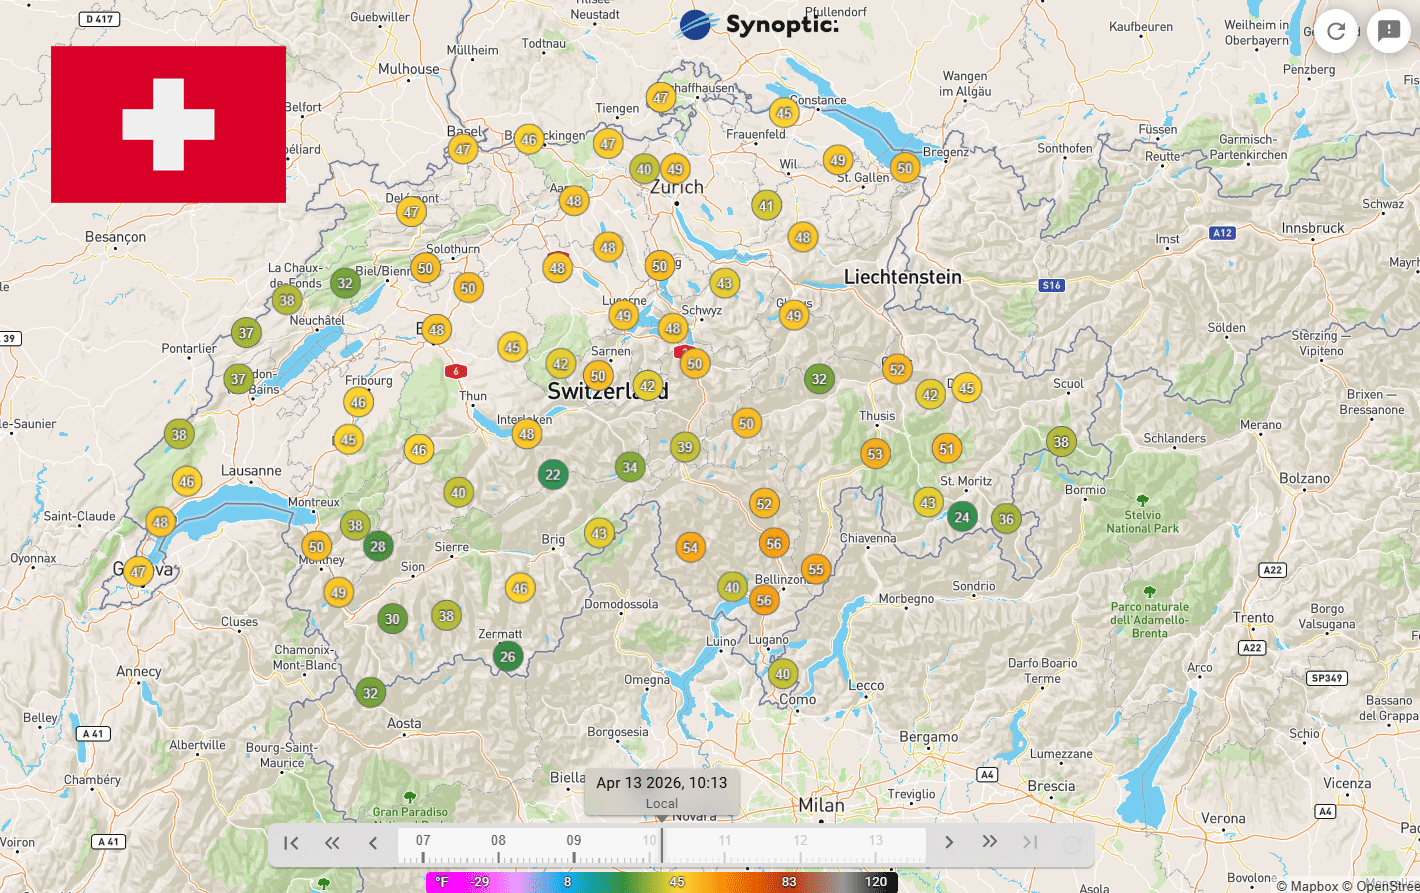
MeteoSwiss
The MeteoSwiss network brings high-quality, national-scale weather and climate observations from Switzerland into the Synoptic platform, adding 99 stations reporting every 10 minutes. These stations report key variables such as air temperature, relative humidity, wind speed/direction/gust, soil temperature, solar radiation, snow depth, and more.
As Switzerland’s official meteorological service, MeteoSwiss operates a robust and modern monitoring network designed to support forecasting, research, and public safety. Integrating this network enhances spatial coverage across complex alpine terrain and provides users with reliable, high-resolution environmental data to improve analysis, modeling, and decision-making. |
|
|
|
|
|
|
|
RAWS Update
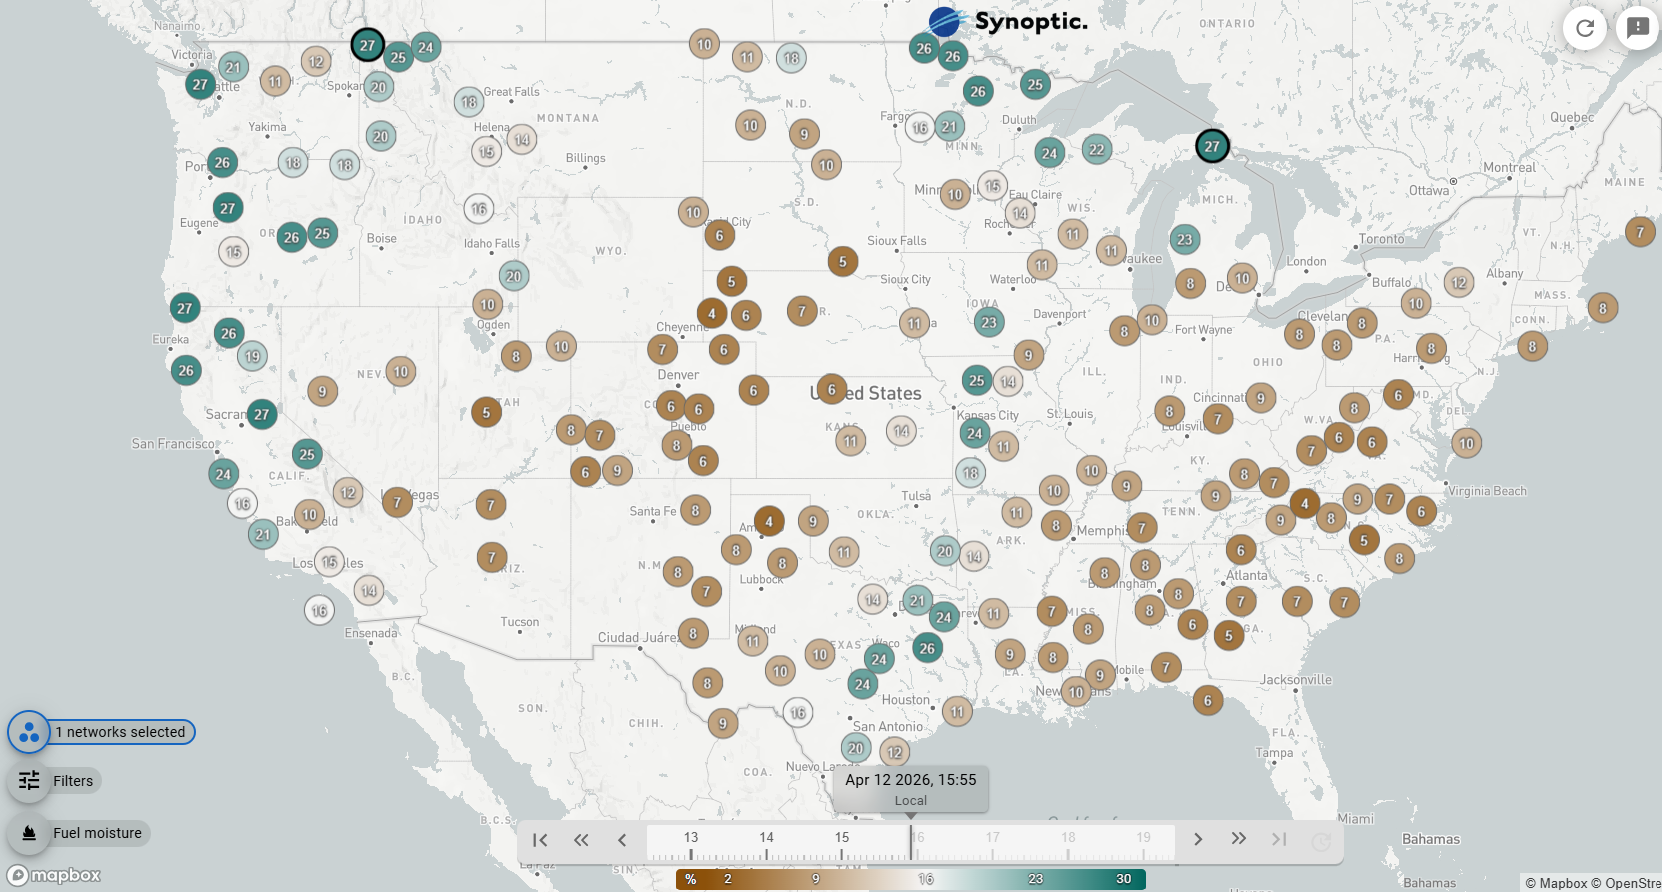
Synoptic is pleased to share that the RAWS (Remote Automated Weather Stations) network has gone through a significant update in the platform. We’ve incorporated changes such as new station locations and refreshed how we access data on the backend, ensuring the dataset remains accurate and reliable. We continue to work closely with data providers to maintain consistency and deliver accurate real-time observations to users.
The RAWS network includes more than 3,300 active stations reporting key variables such as fuel moisture, relative humidity, and wind information — critical inputs for fire weather monitoring and forecasting. Additionally, because RAWS stations are occasionally relocated to meet
operational needs, Synoptic actively tracks and updates station metadata to reflect these changes. These enhancements ensure users have access to the most current and comprehensive fire weather data available, supporting improved situational awareness and decision-making. |
|
|
|
|
|
|
|
Support Docs - New FAQ Pages |
Check out our new FAQ pages! Synoptic is continuing to add frequently asked questions to our website in order to guide users through technical features and common “how tos” for our Weather API, Dashboards & Notifi cations, and other products and services. Links to our FAQ pages are shared below: |
|
|
|
|
|
|
|
|
|
|
|
|
|
|
|
Copyright © 2026 Synoptic |
|
|
|
|
|