|
|
|
|
How Weather Data Helps Growers Stay One Step Ahead of Pests |
|
Across the U.S., growing season has given way to harvest season. And while farmers are focused on bringing in this year's crops, planning for next year's growing season is never far from their minds. Agriculture comes with plenty of challenges, and weather plays a role in many of them. But what does weather have to do with managing pests? Quite a lot, actually.
|
|
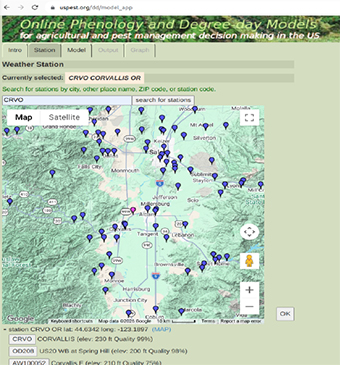
For 30 years, Oregon State University's USPest.org has been helping growers and agricultural professionals use weather data to predict pest activity, manage crop diseases, and make more informed decisions. With access to observations from tens of thousands of weather stations through Synoptic, the platform turns environmental data into practical tools that support agriculture nationwide. Click below to read the full story and learn how weather observations are helping protect crops and improve pest management decisions.
|
|
|
|
|
|
Product Spotlight: Data Viewer Features |
|
The Synoptic Data Viewer displays data from thousands of environmental stations together in one map-based platform, making it easy to explore and visualize real-time observations. The Data Viewer has many great features, which you may or may not have used yet. We’ve highlighted a few of them below and encourage you to try them out. And we’re always looking for feedback to improve the platform; if you have any comments, simply click the exclamation point symbol at the top of the page and complete the survey.
|
|
Time slider with day, hour, and 5-minute steps: This feature at the bottom of the map lets you step through an event to watch how conditions changed.
Station plot variable: Select Station Plot in the variables section to view more than one variable at the station.
Tabular view: Displays conditions from the past 48 hours. Plot a meteogram of the data at the click of a button and see QC fl ags (indicated by a yellow icon).
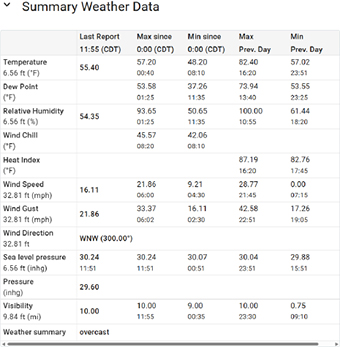
Weather Summary: Located in the Table view, see the last report, max and min values since midnight, and max and min values from the previous day.
|
|
|
|
Save Favorites: Log in to save custom views to a library, grouped by page, and get back to the stations and maps you use most in one click.
For the U.S.: Add county boundaries, radar overlay, local storm reports, and hazards.
|
|
|
|
|
|
New Networks:
Additional 3D-PAWS Datasets
|
|
The 3D-Printed Automated Weather Stations (3D-PAWS) network continues to grow! Following last month’s update on new data from the Dominican Republic, Fiji, and Kenya, we’ve now added observations from seven additional countries: Argentina, the Bahamas, Madagascar, Malawi, Trinidad and Tobago, Vanuatu, and Zimbabwe.
Through our work with UCAR, Synoptic is helping make these observations easier to access, visualize, and share, supporting local meteorological services and the broader global weather community. As the project expands, more countries and stations will continue to come online, helping fill critical gaps in weather observation coverage around the world.
|
|
|
|
|
|
Synoptic has been busy the last few weeks participating in several industry events to meet with customers and present about partnerships and advancements in weather technology. See our team in action and click the links to learn more about the events.
|
|
|
|
|
|
|
|
|
|
|
|
|
|
Look for Synoptic at these upcoming
conferences:
107th AMS Annual Meeting - American Meteorological Society
January 10-14, 2027 | Denver, CO
Booth 608
Synoptic is hosting a Town Hall on Monday, January 11, and our team will be presenting sessions as well on Monday, Tuesday, and Wednesday during the conference. More details to come soon!
|
|
|
|
Browse the links below to access helpful tips and documentation for Synoptic's products. |
|
|
|
|
|
|
|
|
|
|
|
|
|
|
|
Copyright © 2026 Synoptic |
|
|
|
|
|