Weather API
Synoptic’s Weather API is a powerful tool for accessing real-time and historical weather, water, and other environmental observations from over 120,000 public and private stations. We aggregate, process, and disseminate data from over 320 networks worldwide with 140 million daily observations.
This RESTful API, formerly known as the Mesonet API, is a request-based data delivery service that is highly flexible to retrieve minutes or months of data from one or many stations across the globe in seconds. Synoptic’s Weather API allows for complete customization, allowing the user to request specific variables at any time for any location.
Weather API Features:
- Simple single step REST-ful download.
- Diverse output formats including JSON, geoJSON, CSV and XML for many services.
- Refined precipitation and quality control parameters to give quick access to the most critical data requests.
- Integrated quality control which can highlight or remove erroneous values.
- CORS and JSONP supported for direct integration into web applications.
- Access to proprietary data and unlimited concurrent requests available for enterprise customers.
Example 1:
With the Weather API you can recreate the map of observations seen on the Synoptic Data Viewer. The following snapshot shows current air temperature observations across Salt Lake City:
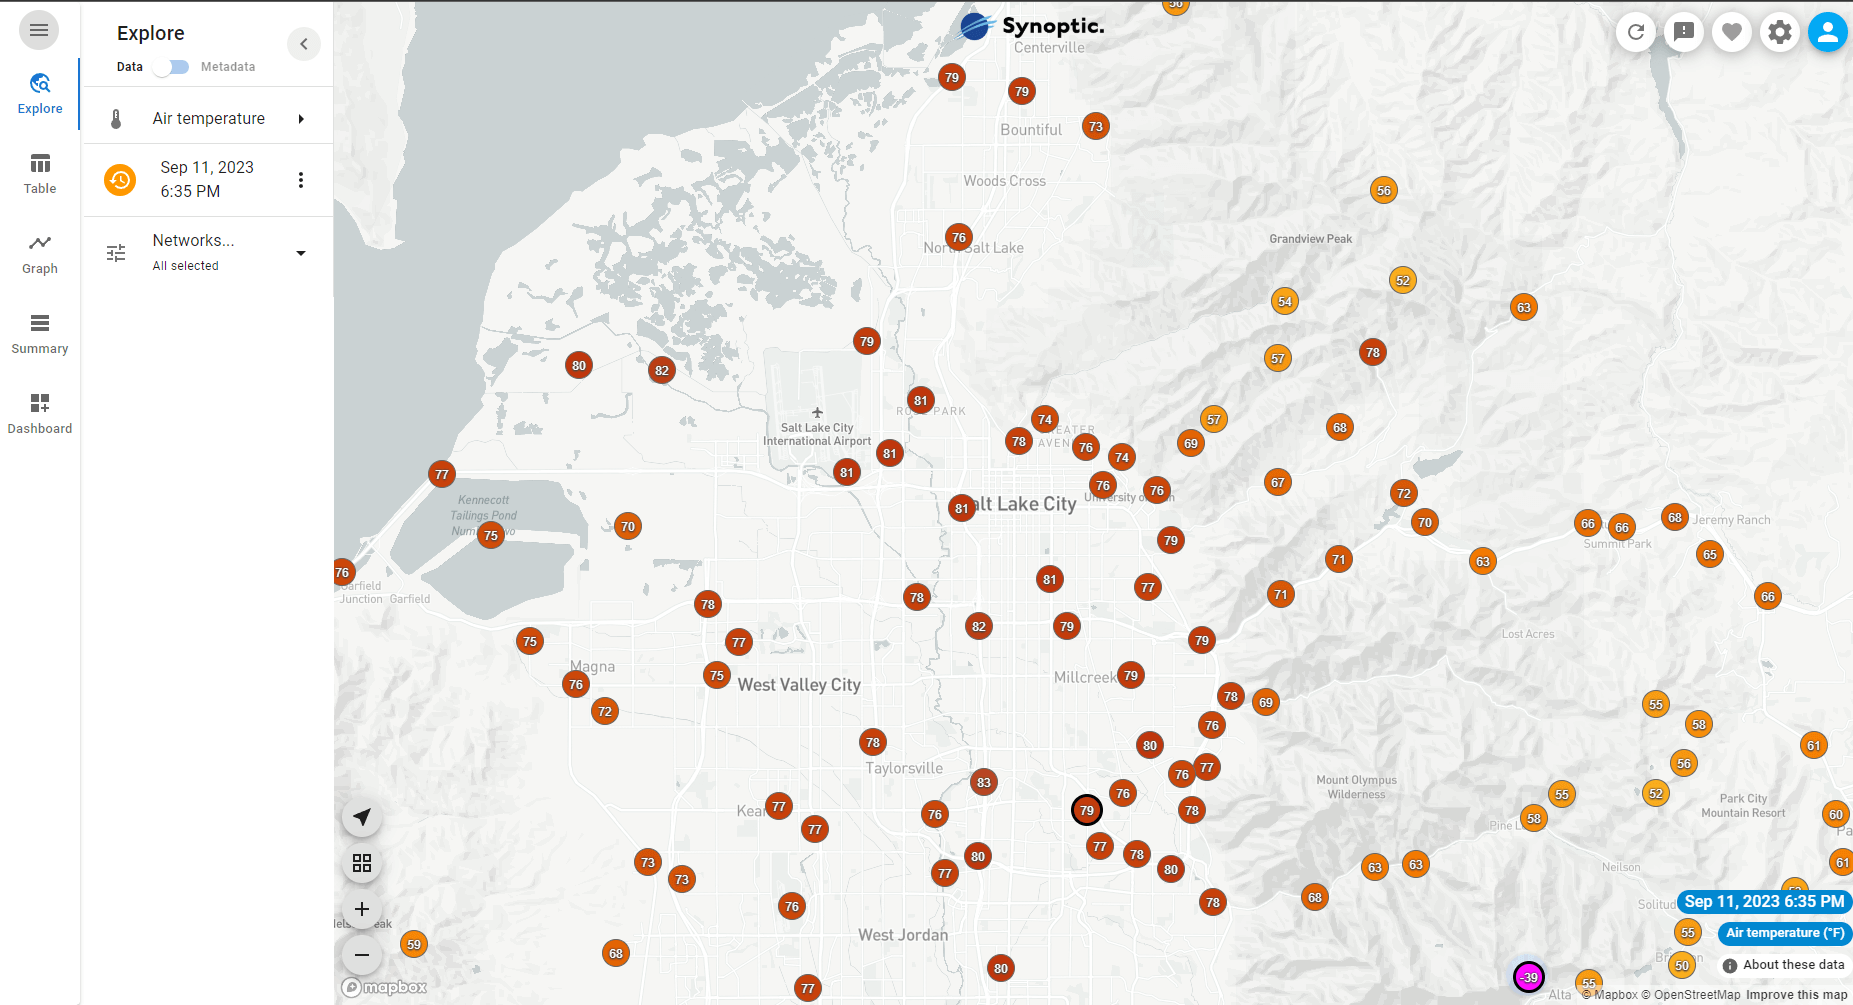
Using the Weather API’s Latest service, we can build the following query:
https://api.synopticdata.com/v2/stations/latest?bbox=-112.291260,40.544070,-111.593628,40.972640&vars=air_temp&token=[YOUR_TOKEN]
This Weather API query returns a JSON object for each reporting station, containing a suite of metadata in addition to the observed air temperature.
You will need to create your own account by signing up here, and after your account is validated creating a token within the customer console, to test out the above query.
Example 2:
With the Weather API, you can recreate the same graphs of observations seen on the Synoptic Data Viewer. The following graph displays the past 7 days of recorded air temperature along with derived dew point and heat index observations for a single station:
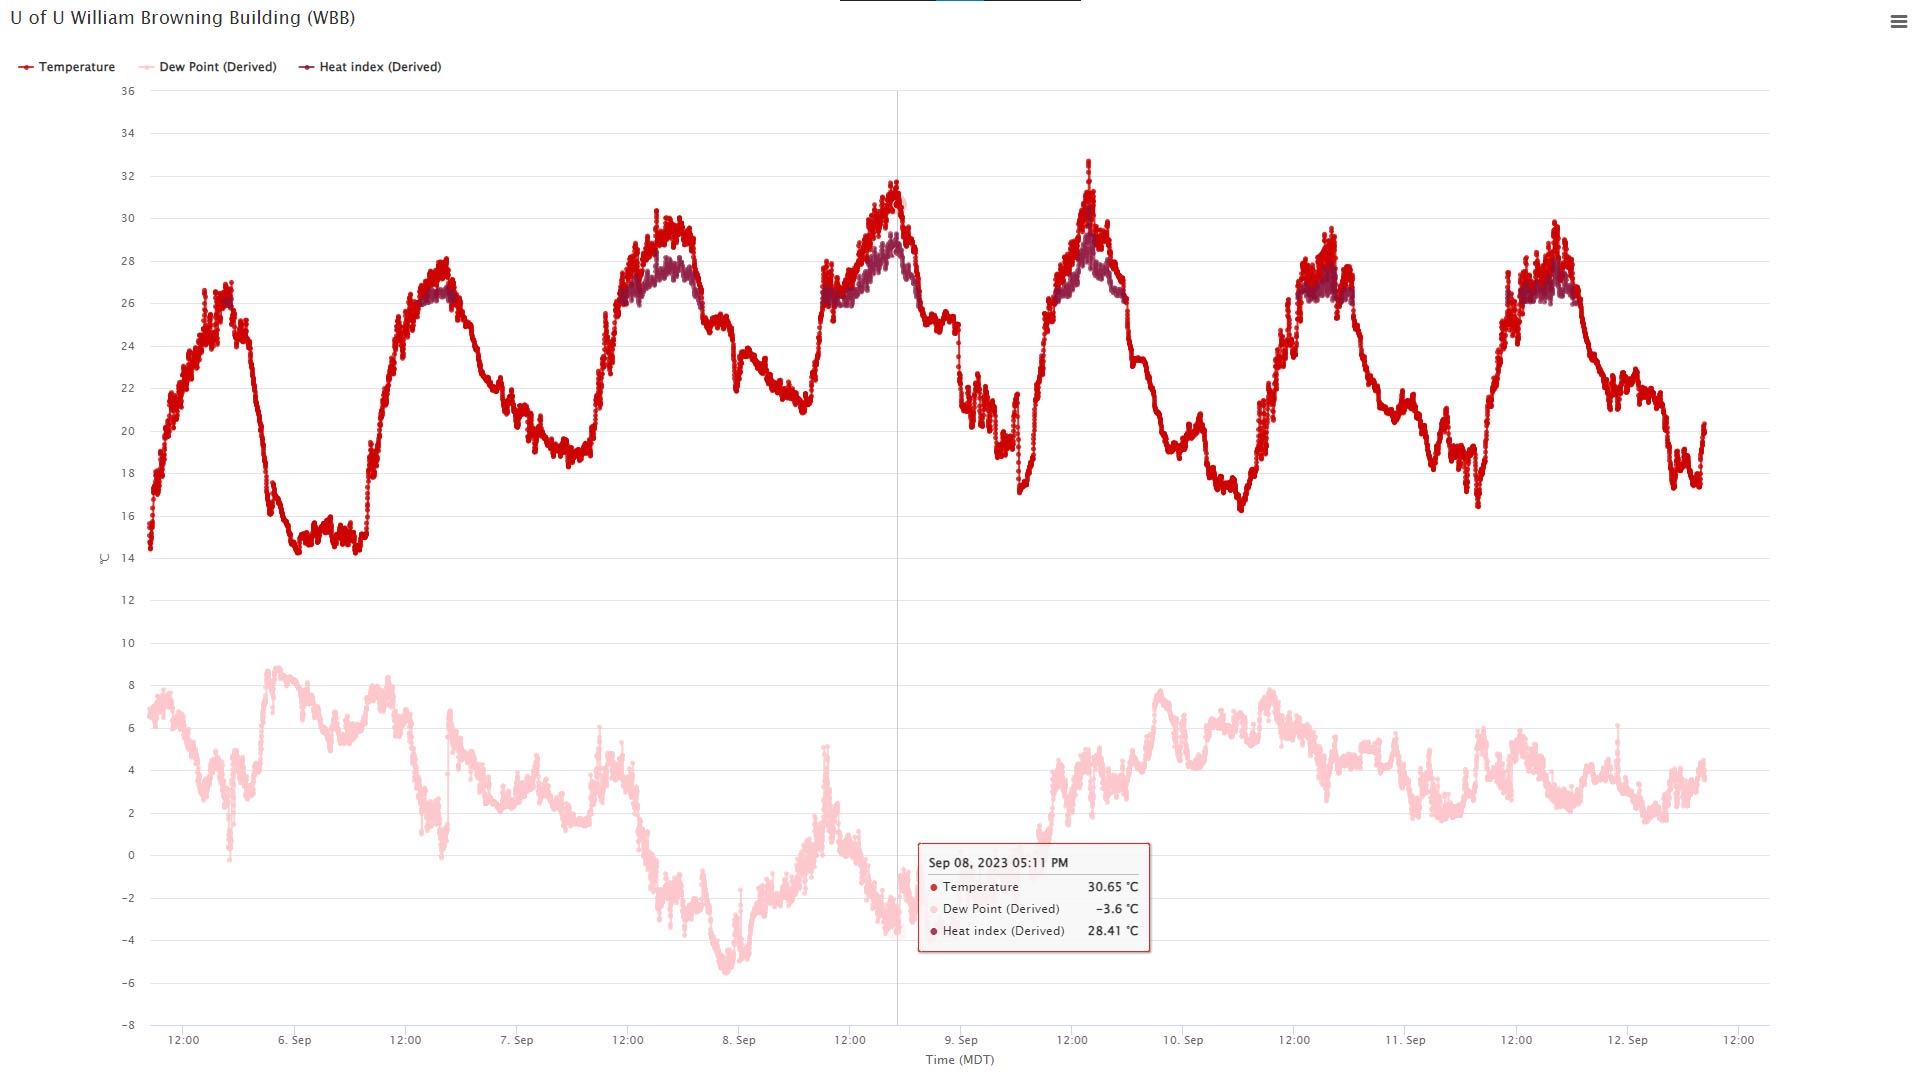
Using the Weather API’s Time Series service, we can build the following query:
This Weather API query returns a JSON object for the station, containing a suite of metadata in addition to the observed time series for each variable.
You will need to create your own account by signing up here, and after your account is validated creating a token within the customer console, to test out the above query.